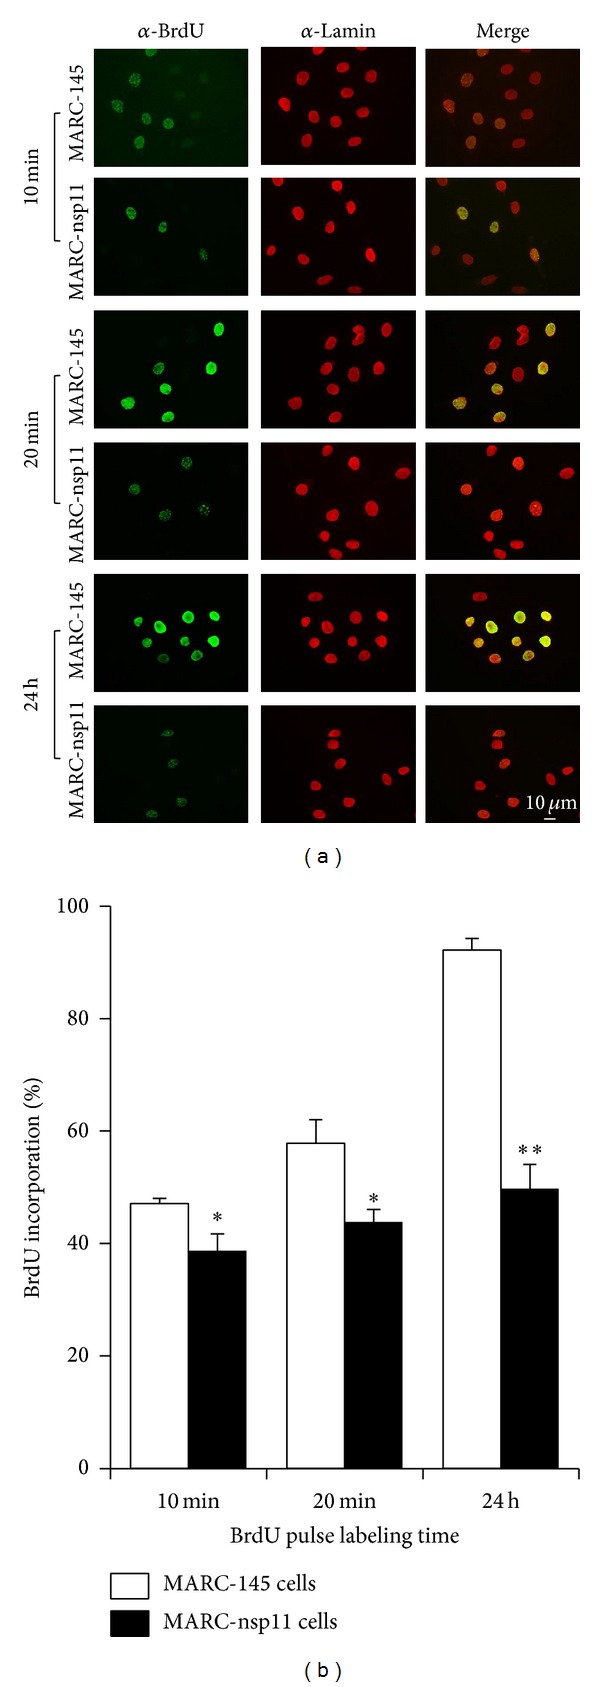
Figure 5.

BrdU incorporation and DNA synthesis in MARC-nsp11 cells. (a) Cells were labeled with BrdU and stained to determine the newly synthesized cellular DNA at the S phase. Cells were pulse-labeled with 10 μM of BrdU for 10 min and 20 min, or 100 nM for 24 h. Cells were fixed with 2% paraformaldehyde for 15 min and permeabilized with 0.5% Triton X-100 followed by staining with an anti-lamin antibody (shown in the red color). Cells were then incubated with 4N HCl to denature the DNA, and stained for DNA-incorporated BrdU using an anti-BrdU antibody (shown in the green color). The scale bar in white indicates 10 micron. (b) BrdU incorporation rates in MARC-nsp11 cells. A total of 200 lamin-positive cells were counted, and of the 200 cells BrdU-positive cells were counted. The BrdU incorporation rates were then calculated using the following formula: (number of double-positive cells for BrdU and lamin)/(200 lamin-positive cells) × 100. The experiments were repeated 4 times and the results were presented as the arithmetic means ± standard error (n = 4). One star (∗) represents P < 0.005 and two stars (∗∗) represent P < 0.001. MARC-145 cells are indicated in unfilled white bars and MARC-nsp11 cells are indicated in black bars.
