
Figure 1.
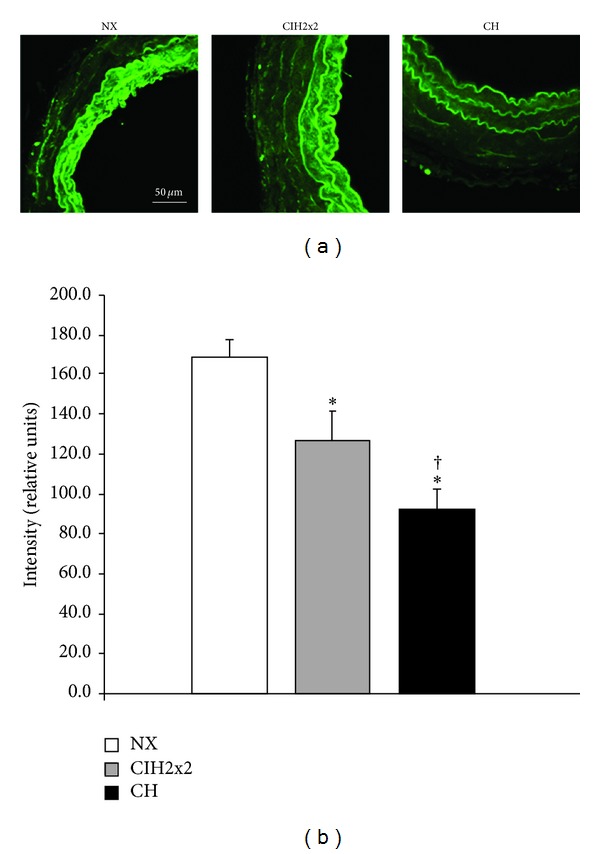
DAF-2 DA intensity levels in pulmonary arteries from rats exposed to normoxia (NX, n = 10), intermittent hypoxia (CIH2x2, n = 10), or chronic hypoxia (CH, n = 10). (a) Representative examples of projections obtained from confocal microscopy images (×40 zoom 2). (b) Quantitative analysis; n represents the number of animals; *P < 0.05 compared to NX; † P < 0.05 compared to CIH2x2.