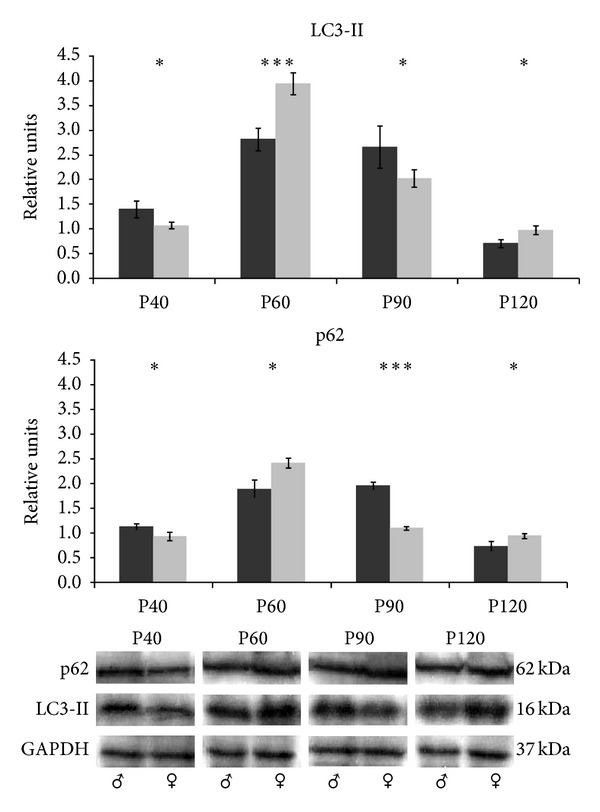
Figure 2.

LC3-II and p62 protein expression in the spinal cord. Western blot for LC3-II and p62 proteins in spinal cord tissue from male (black bars) and female (grey bars) mice and its quantitative analysis relative to GAPDH. The representative blots for each age, sex, and protein are shown at the bottom. Data show mean ± SEM of twelve mice. p value <0.05 (*) and <0.001 (***).
