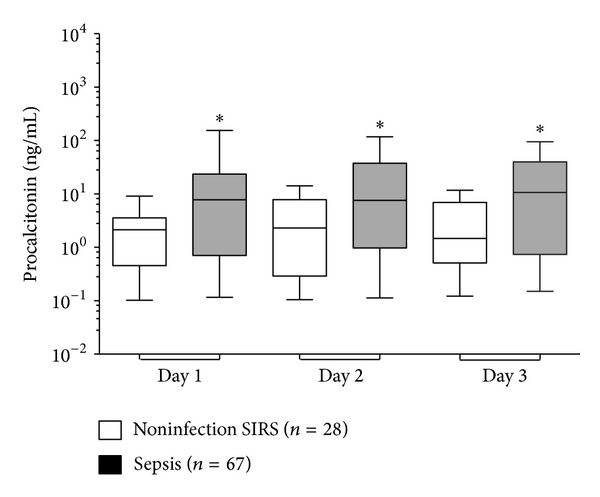
Figure 1.

Daily concentration of PCT in sepsis and noninfectious SIRS. Boxes show the median and interquartile range, whiskers show 10–90th percentiles. *Mann-Whitney test between sepsis and noninfectious SIRS for procalcitonin, P = 0.02 (days 1 and 2) and P = 0.03 (day 3).
