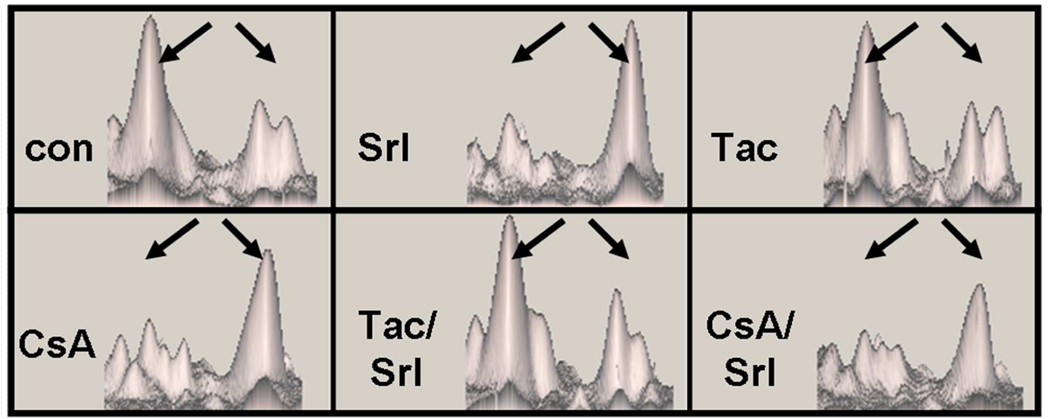
Figure 5. Immunosuppressant-induced changes of regucalcin compared to vehicle controls after 28 days of treatment.
The two spots associated with regucalcin as displayed in the IMAGE-Master software are shown. The pI and molecular weight as detected on the gel matched the theoretical values of regucalcin (Figure 2). The spot at pH 4.35 and 33kDa (left spot) is markedly reduced after treatment with sirolimus, cyclosporine and cyclosporine + sirolimus. This is associated with the increase of volume of a corresponding spot (right) at the same molecular mass but at a different pH (4.25). Both spots were independently cut from the gel, digested and identified by HPLC/MS analysis. The right and left spots showed amino acid coverage of 41% and 38% with 10 and 9 distinct amino acids, respectively. Abbreviations: con: vehicle controls, CsA: 10 mg/kg/d cyclosporine, CsA/Srl: 10 mg/kg/d cyclosporine+ 1 mg/kg/d sirolimus, Srl: 1 mg/kg/d sirolimus, Tac: 1 mg/kg/d tacrolimus, Tac/Srl: 1 mg/kg/d tacrolimus + 1 mg/kg/d sirolimus.

