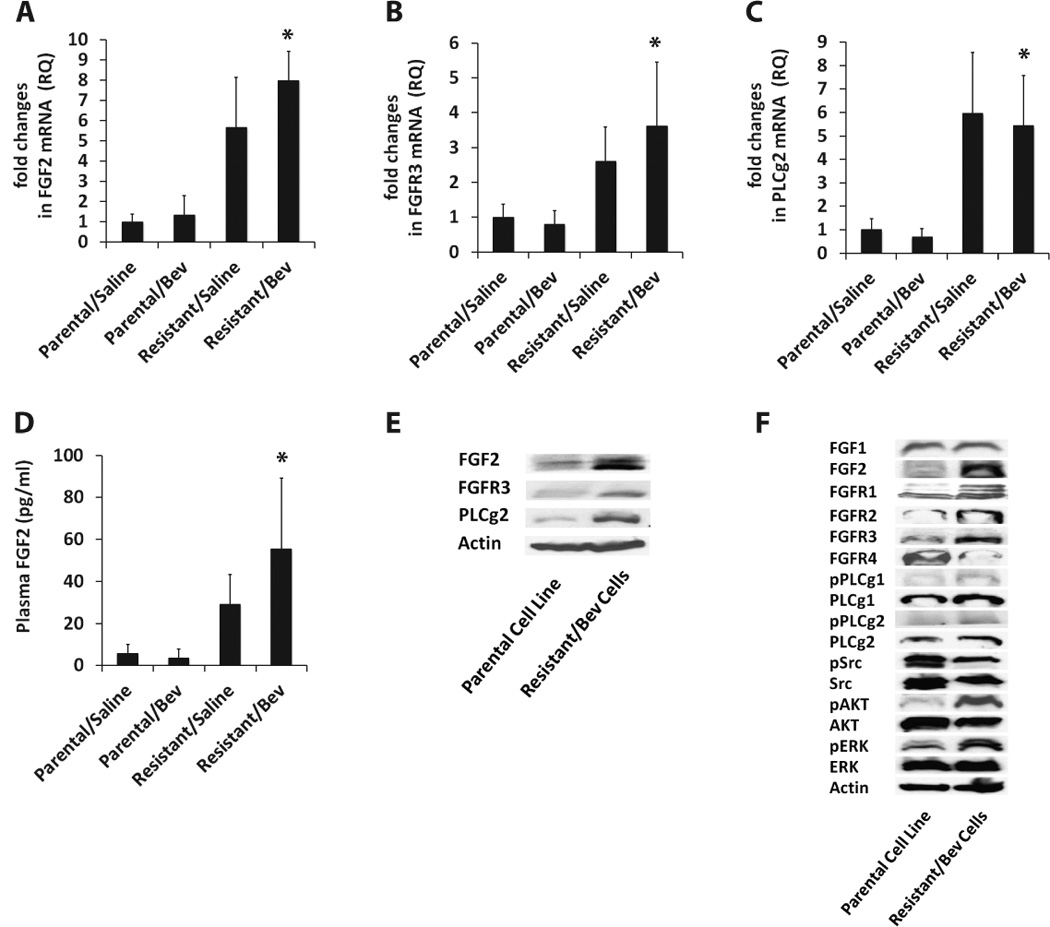
Figure 4. Upregulation of FGF signaling in resistant xenografts.

(A–C) qRT-PCR analysis of FGF2, FGFR3 and PLCg2 mRNA levels reveal 6-fold, 4.5-fold and 8-fold increase in expression in resistant/bevacizumab tumors compared to parental/bevacizumab tumors respectively (* FGF2; P=0.0002, FGFR3; P=0.0439, PLCg2; P=0.0160). (D) Plasma FGF2 protein levels were significantly higher in resistant/bevacizumab tumors compared to parental/bevacizumab tumors (* P=0.0441) as shown by ELISA. (E) Western blot analysis confirms increased protein levels of FGF2, FGFR3 and PLCg2 in tumor cells expanded from bevacizumab-treated resistant xenografts compared to the parental Tu138 cell line. (F) Increased expression of FGF2 ligand, FGFR1–3 receptors and downstream proteins, phospho PLCg1, total PLCg1, phospho PLCg2, total PLCg2, phospho AKT and phospho ERK in resistant cells.
