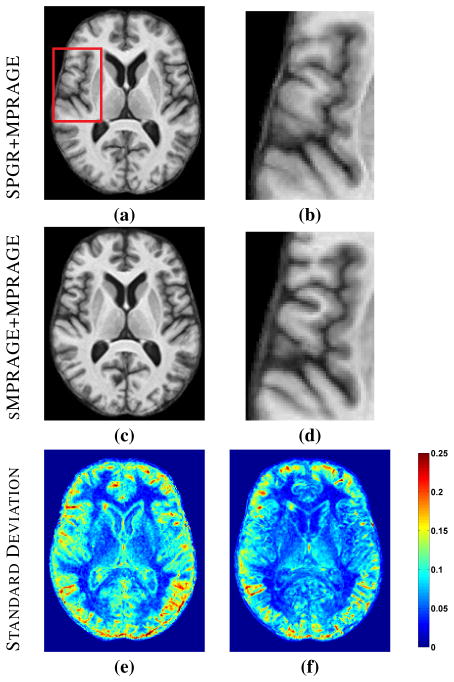
Fig. 6.
(a) Average atlas created using SyN from five BLSA (SPGR) and five OASIS (MPRAGE) images and (b) a zoomed region. (c) Average atlas from five synthetic MPRAGEs from BLSA and five OASIS images (MPRAGE) and (d) a zoomed region. (e) Intensity standard deviation image from SPGR+MPRAGE atlas and (f) intensity standard deviation image from sMPRAGE+MPRAGE atlas.

