Figure 3.


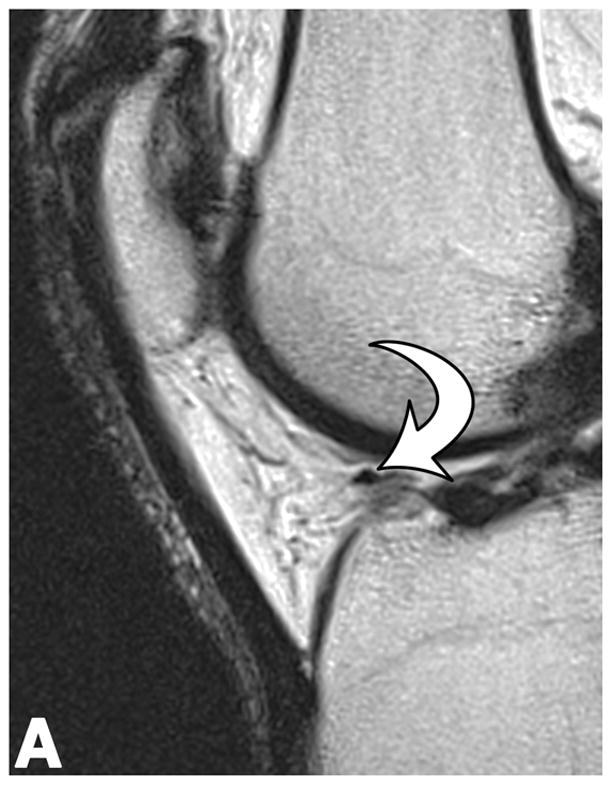
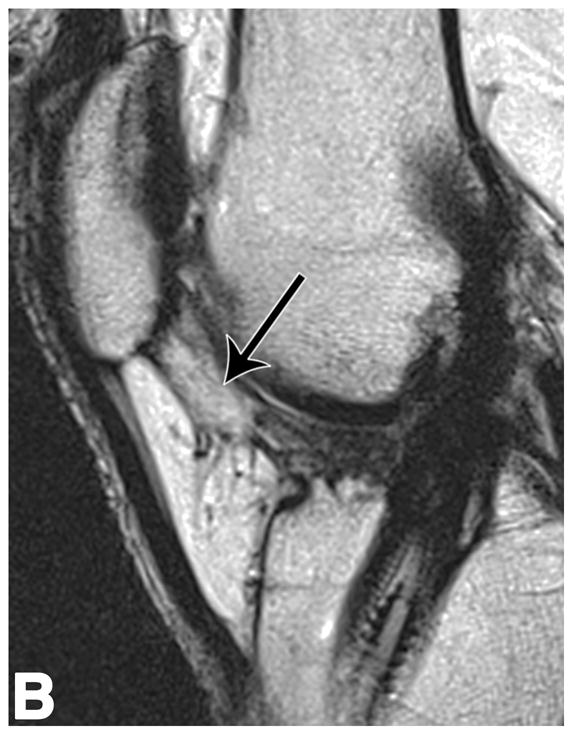
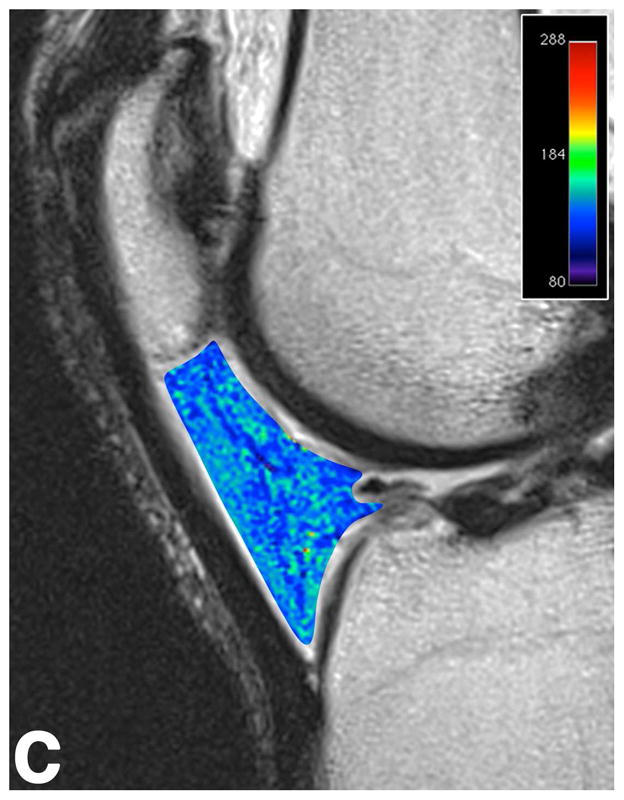
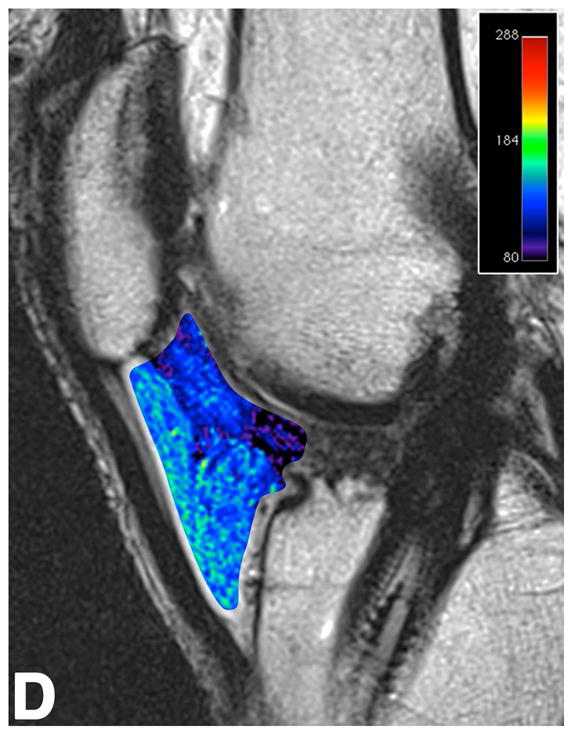
Sagittal T2-weighted (TR/TE = 1700/106) MR images of bilateral knees of a 46-year-old male, with history of prior left ACL arthroscopic repair using hamstring tendon graft (3.6 years ago). (A) Non-operated right knee shows normal appearance of the IFP and transverse meniscal ligament (curved arrow). (B) Operated left knee shows area of presumed fibrosis (arrow) affecting the deep portion of IFP. (C) Overlaid T2 relaxation map of non-operated right knee with mean values of 145 ± 12 ms. (D) Overlaid T2 relaxation map of operated left knee showing shorter mean T2 values (130 ± 27 ms). The T2 relaxation maps use a narrow scale from 80 to 288 ms for illustrative purposes.
