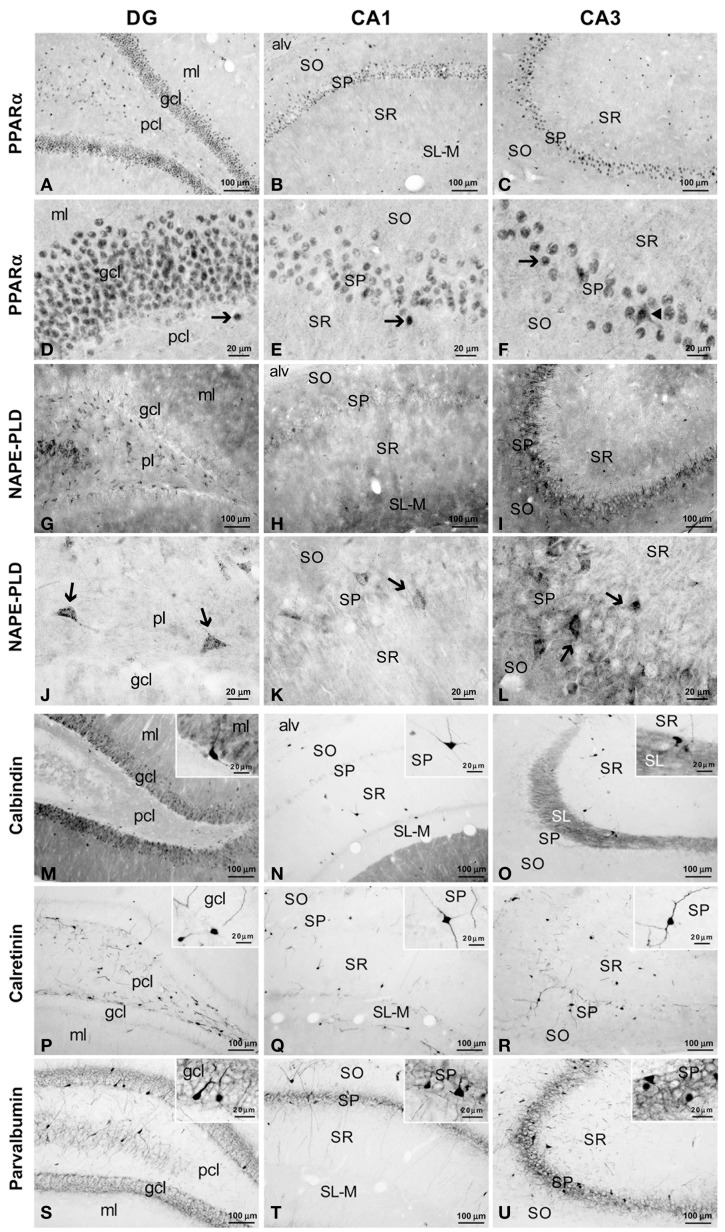
Figure 2.
Immunohistochemical expression of PPARα (A–F), NAPE-PLD (G–L) and the CaBPs calbindin (M–O), calretinin (P–R) and parvalbumin (S–U) in the medial rat hippocampus. (A–F) Arrows indicate PPARα expression in the cell nuclei of the dentate granular, pyramidal, and non-pyramidal (interneurons) cells. The arrowhead in (F) indicates the cytoplasmic labeling of PPARα. (G–L) NAPE-PLD was associated with neuropil and puncta in the ml and gcl of the DG and the SO and SP of the CA1/3 fields. The arrows indicate the NAPE-PLD+ cells observed in the pcl of the DG and the SP of the CA1/3 fields. (M–O) Fibers in the ml of the DG and the SL of CA3 and cells in the gcl of the DG and the SO, SP, and SR of the CA1/3 fields were stained for calbindin. (P–R) A discrete number of cells in the pcl of the DG and all strata of the CA1/3 fields expressed calretinin. (S–U) Cells stained for parvalbumin were found in the gcl of the DG and the SP and SO of the CA1/3 fields, whereas fibers were observed in the gcl of the DG and the SP of the CA1/3 fields. For abbreviations, see Table 3 legend. Scale bars are indicated in each image.

