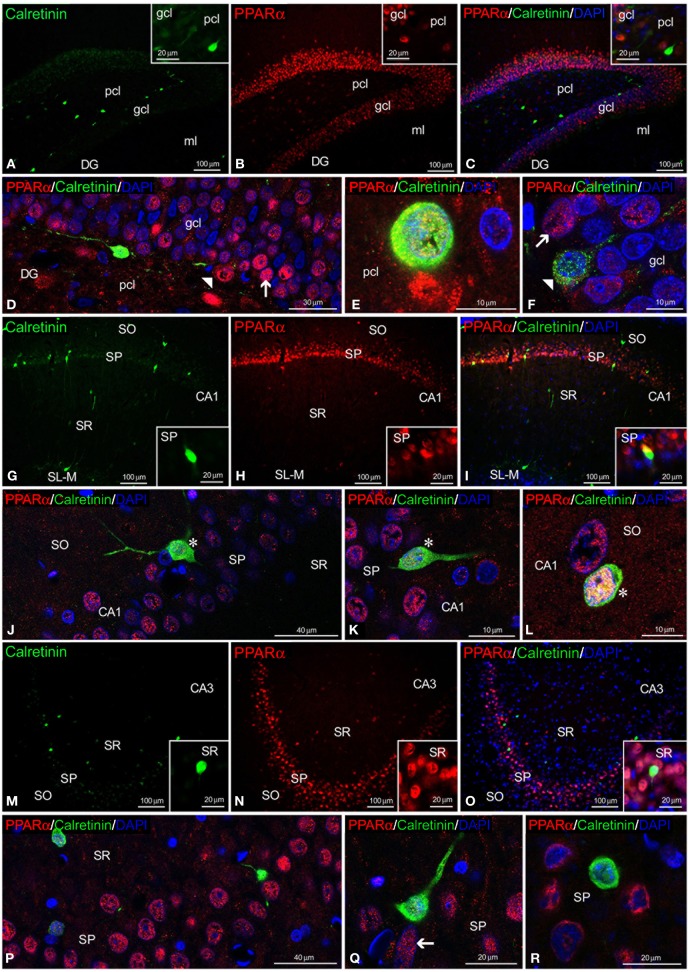
Figure 4.
PPARα and calretinin co-expression in the rat hippocampus. Low-resolution epifluorescence photomicrographs (A–C,G–I,M–O) and high-resolution confocal laser scanning photomicrographs (D–F,J–L,P–R) showing the labeling of calretinin (green) and PPARα (red) in the dentate gyrus (DG), CA1, and CA3 areas. DAPI fluorescence (blue) is also shown. The arrows indicate PPARα expression in the cell nucleus. The arrowheads indicate the cytoplasmic labeling of calretinin. The asterisks indicate examples of cells that co-express PPARα and calretinin. For abbreviations, see Table 3 legend. Scale bars are indicated in each image.

