Figure 7.
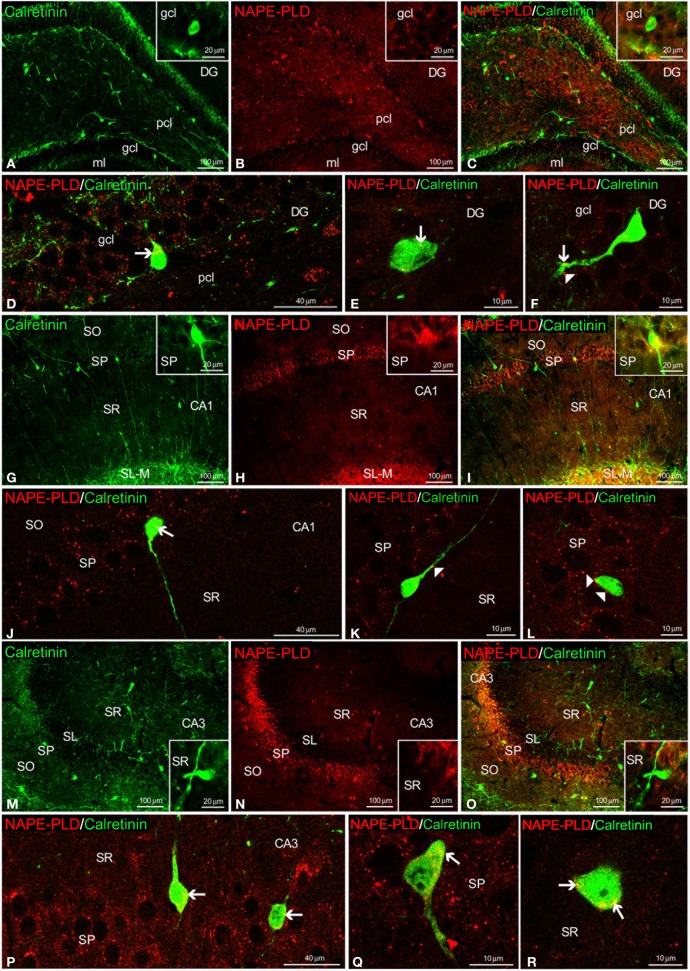
NAPE-PLD and calretinin co-expression in the rat hippocampus. Low-resolution epifluorescence photomicrographs (A–C,G–I,M–O) and high-resolution confocal laser scanning photomicrographs (D–F,J–L,P–R) showing the labeling of calretinin (green) and NAPE-PLD (red) in the dentate gyrus (DG), CA1, and CA3 areas. The arrows indicate NAPE-PLD expression in the calretinin+ cells. The arrowheads indicate the NAPE-PLD+ fiber varicosities on the surface of the calretinin+ cells. For abbreviations, see Table 3 legend. Scale bars are indicated in each image.

