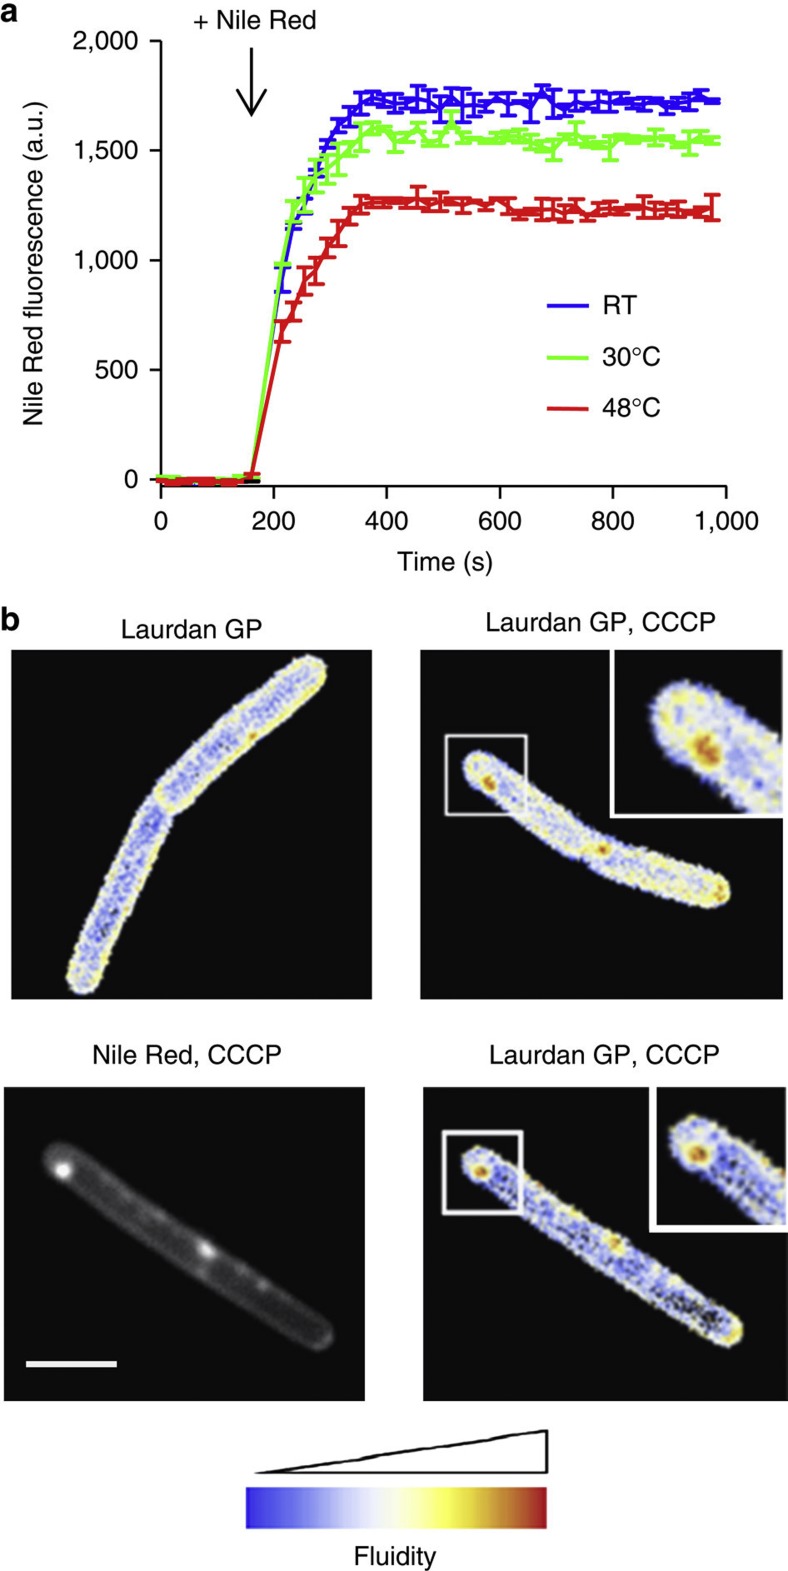
Figure 3. Analysis of cell membrane fluidity.
(a) Nile Red fluorescence intensity of B. subtilis cells grown in room temperature, 30 °C or 48 °C followed by shift to 30 °C, was measured fluorometrically. To prevent rapid adaptation of membrane fluidity67, the measurements were carried out with a lipid desaturase (des)-deficient strain. The curves represent average values with s.d. of three replicate measurements. Strain used: B. subtilis HB5134 (Δdes). (b) Microscopic analysis of fluid membrane domains using Laurdan GP. The images show a colour-coded Laurdan GP intensity map in which red indicates regions of increased fluidity. Membrane fluidity is determined for untreated B. subtilis cells (left panel) and cells treated with CCCP (right panel). See also Supplementary Fig. 10 for the measurement of the average fluidity change. (c) Colocalization of Nile Red foci and Laurdan GP in CCCP-treated B. subtilis cells. Strain used: B. subtilis 168 (wild type). Scale bar, 2 μm.

