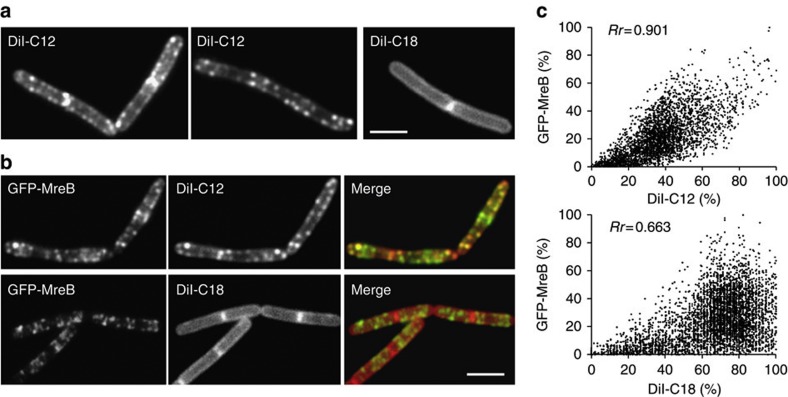
Figure 4. Localization of RIFs in untreated B. subtilis cells.
(a) RIFs can be visualized in normally growing untreated B. subtilis cells using the fluid membrane dye DiI-C12 (left panel). Staining with the long acyl-chain variant, DiI-C18, reveals a regular (smooth) membrane signal (right panel). Strain used: B. subtilis 168 (wild type). (b) Colocalization of DiI-C12 and GFP-MreB (see Supplementary Fig. 11 for more examples and statistical analysis of colocalization). Strain used: B. subtilis YK405 (gfp-mreB). (c) Fluorescence intensity correlation graphs are shown for the cells in panel b. The graphs display a pixel by pixel intensity correlation between DiI and GFP-MreB fluorescence, and shows the Pearson’s correlation coefficients (Rr) (see Supplementary Fig. 11 for details). It should be mentioned that some fluorescence correlation between DiI-C18 and GFP remains since both DiI-C18 and MreB are present in the cell membrane. Strain used: B. subtilis YK405 (gfp-mreB). Scale bar, 2 μm.

