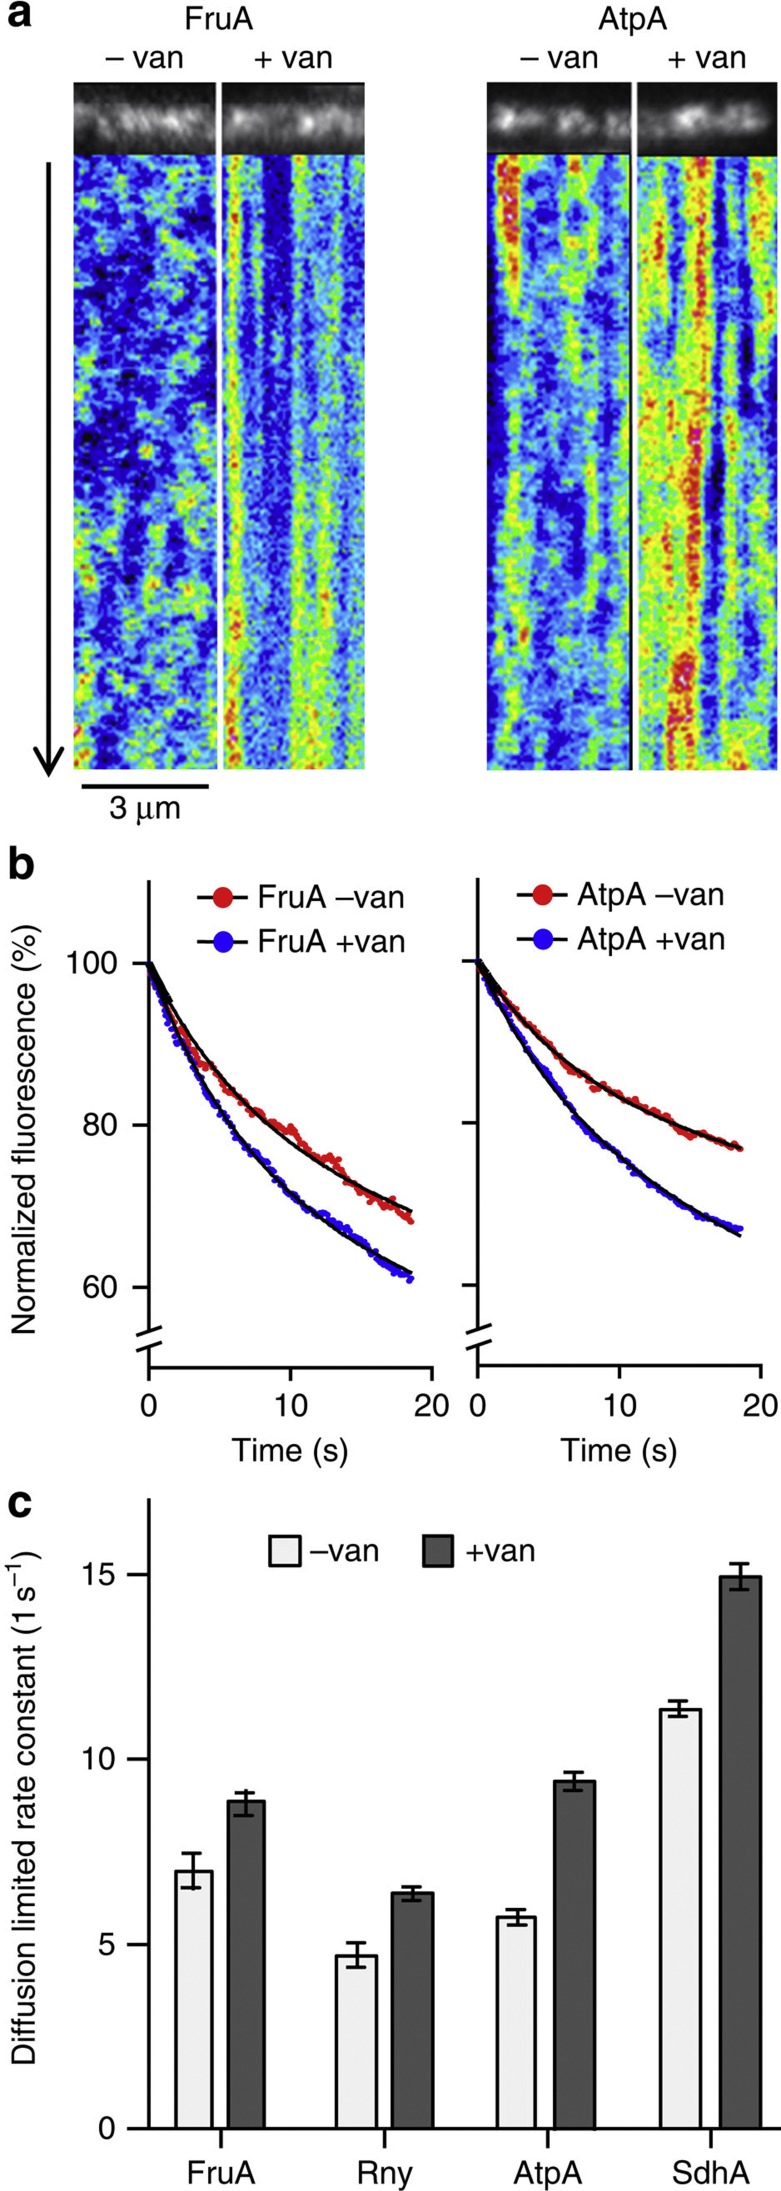
Figure 8. MreB movement influences membrane protein diffusion.
(a) Kymographs visualizing the diffusion of fructose permease (FruA) and F1Fo ATP synthase (AtpA) in the absence and presence of vancomycin (van), which blocks MreB movement. Time lapse series with 20 s length and 100 ms time resolution was acquired using TIRF microscopy. See Supplementary Movie 5 for corresponding raw image series. (b) In TIRF microscopy, only proteins within the vicinity of the evanescent light (<200 nm distance from the coverslip surface) are subject to fluorophore (GFP) bleaching. The graphs depict the averaged, normalized and background-subtracted fluorescent signals of fructose permease (FruA) and F1Fo ATP synthase (AtpA) in the presence (− van) and absence (+ van) of MreB movement. A significant increase in bleaching is observed when movement of MreB is inhibited with vancomycin, which indicates a reduced diffusion of proteins in and out of the range of the evanescent light. The curve fits were performed using a two-phase exponential decay model composed of a rapid bleaching of GFP within the range of the evanescent wave, and slower (diffusion limited) bleaching of the whole cell fluorescence (see Supplementary Fig. 14 for details). (c) Rate constants and s.e. of slow (diffusion limited) bleaching kinetics for Fructose permease (FruA), RNaseY (Rny), F1Fo ATP synthase (AtpA) and Succinate dehydrogenase (SdhA) in the absence and presence of vancomycin. Increased rate constant indicates a reduced exchange of protein between the TIRF-illuminated area and rest of the cell surface. The number of analysed cells, goodness-of-fit and s.e. are provided in Supplementary Fig. 14. Strains used: B. subtilis BS23 (atpA-gfp), BS112 (sdhA-gfp), FruA-GFP and 3569 (rny-gfp).

