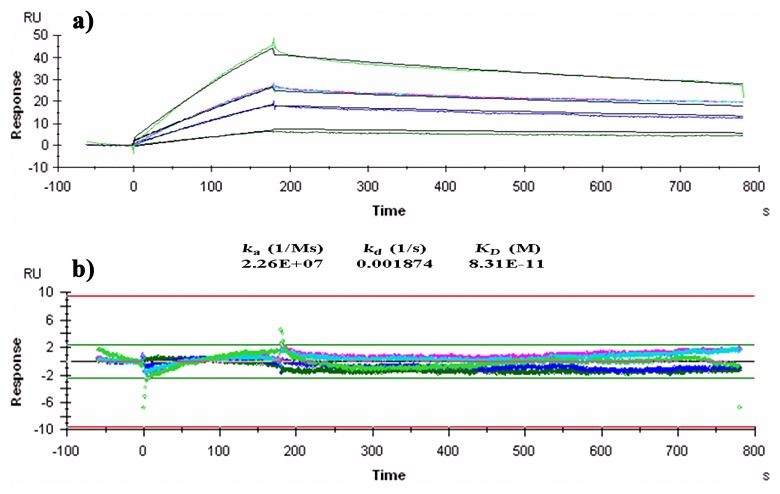
Fig. 3.
(a) BIAcore analysis of anti-bovine IgA scFv. Sensogram demonstrates the binding and dissociation of scFv. Affinity was calculated assuming 1:1 binding and curve fitting of the sensogram. RU = Response Unit; Time in seconds; ka = association rate constant; kd = dissociation rate constant; KD = equilibrium dissociation constant/affinity constant. (b) Residual distribution plot of response in the kinetic analysis. In both figures, ligand (anti-IgA scFv) concentration was kept constant (50 ng/ml), and analyte (bovine IgA) concentration was varied and represented in different colors, 20 ng/ml (dark green), 50 ng/ml (purple), 100 ng/ml in duplicate (pink and sky blue), and 125 ng/ml (light green)

