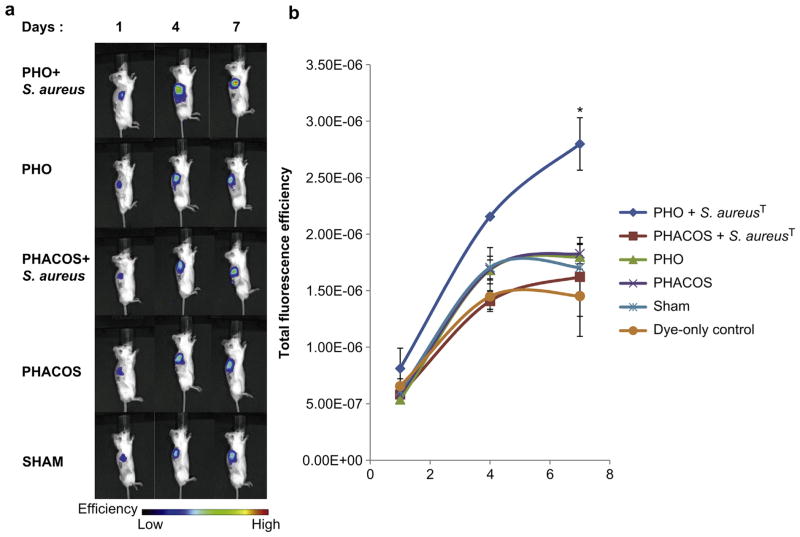
Fig. 6.
In vivo ROS imaging of PHACOS and PHO implant-associated inflammation after subcutaneous administration of H-ICG. (a) Bioimaging data of animals. (b) Quantification of bioimaging ROS fluorescence data of mice with PHACOS and PHO implants incubated with S. aureusT and sterile PHACOS and PHO implants (*P < 0.05 between sham and implant, n > 3 mice/time point for sham and implant groups).

