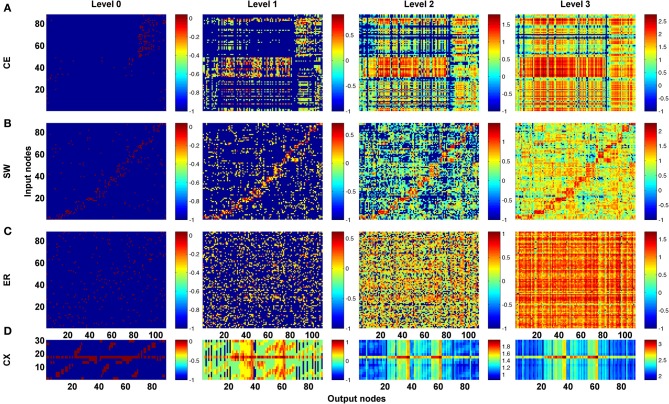
Figure 3.
The channel connectivity matrices demonstrate the existence of distinct information propagation patterns among different networks. Each element in a matrix represents a pair made up of an input node/neuron and an output node/neuron (called a “channel”). The color of each element indicates the number (on a logarithmic scale, see Methods) of one-way paths between the given input and output nodes/neurons at the given propagation level. Therefore, the matrices display the connectivity of each channel. (A) The channel connectivity matrices at different levels for the C. elegans (CE) neural network. There is a significant difference in the channel connectivity between level 0 (direct link) and level 1 (through 1 intermediate node). However, the connectivity patterns are very similar between level 1 and level 2 (and higher), indicating that information propagation patterns are quickly stabilized above level 1 propagation. (B) The matrices for a classic small-world (SW) network. The connectivity patterns are more similar between level 0 and level 1 in SW compared to the CE network. (C) An Erdős–Rényi random (ER) network showing how the connectivity patterns are significantly different between each level and the next-higher level. (D) The partial central complex network (CX) of Drosophila demonstrating quickly stabilized channel connectivity patterns after level 1 as in the CE network.

