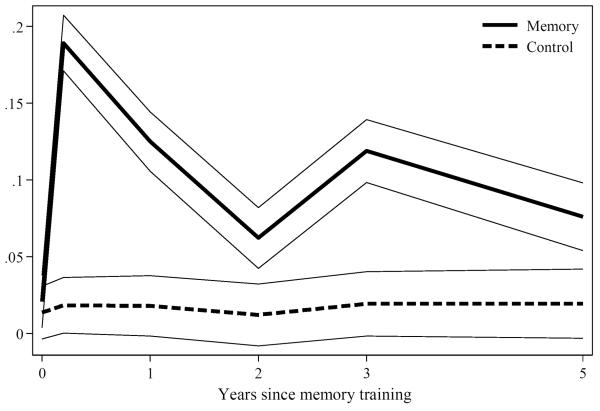
Figure 2.
Proportion of Participants Who Skipped Spaces on AVLT for Each Assessment by Training Status: Results from ACTIVE (N=1,401)
Legend. Time trend plots of the proportion of participants who skipped spaces on the AVLT in the memory-trained (solid line) and control (dashed line) groups. The percentage of participants who skipped a space on an AVLT trial is shown on the ordinate. 95% confidence bands are shown for each group.

