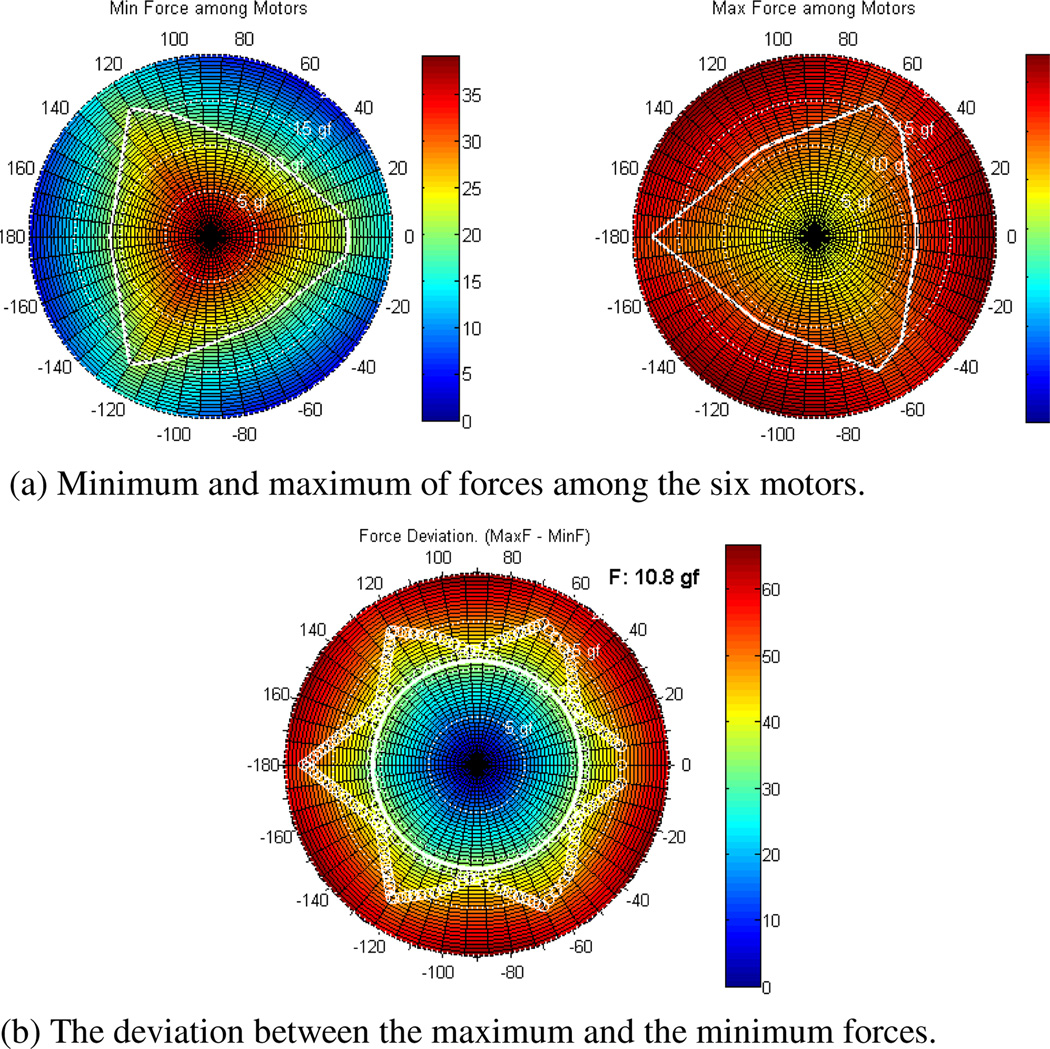
Fig. 3.
Force distribution with respect to the side load applied at the assumed RCM. The amount of the force and the applying direction are graphically indicated by the radius (0 to 20 gf) and the angle (0 to 180°), respectively, in the polar plots. Given a threshold of the available force on the motors, the tolerable side load is calculated by overlapping two contours from (a).

