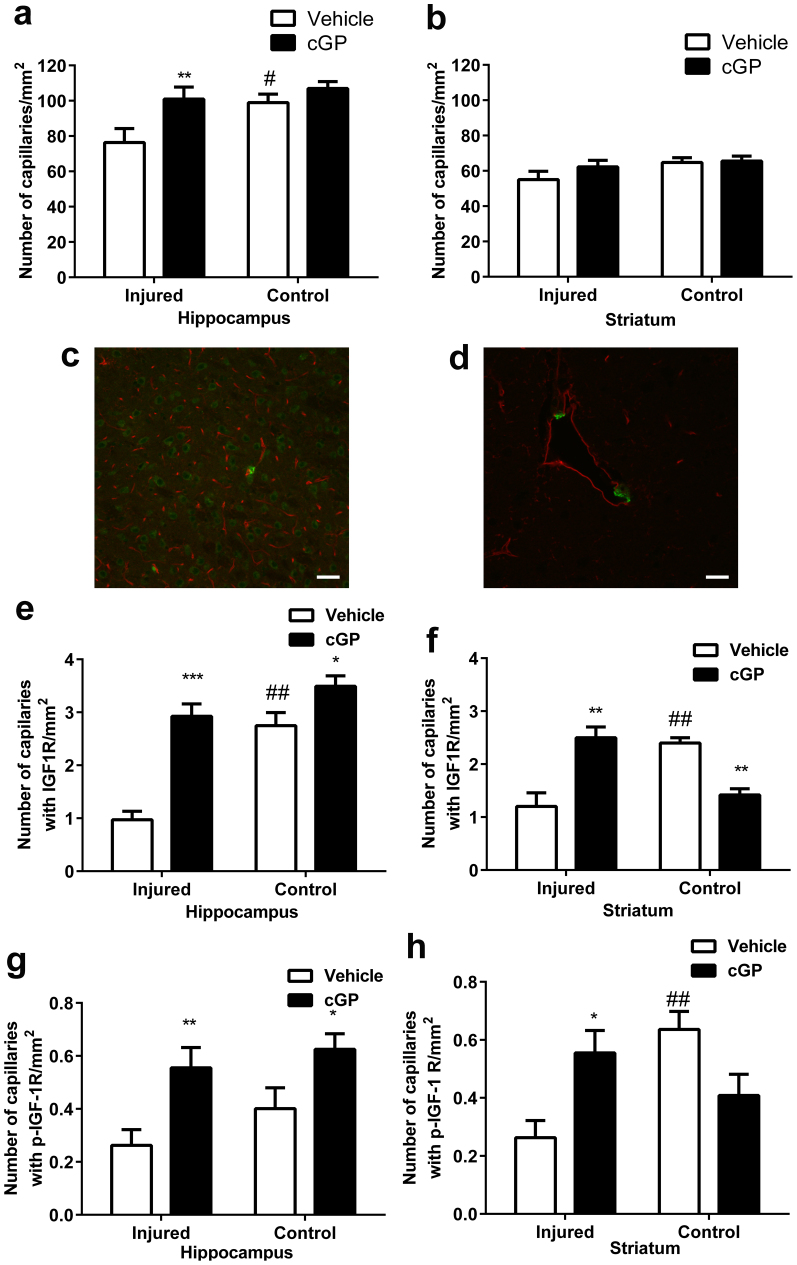
Figure 1. cGP prevents vascular loss by promoting IGF-1 associated vascular remodelling.
(a), Vascular density in the hippocampus after either vehicle (open bars, n = 12) or cGP (black bars, n = 13) treatments. (b), Vascular density in the striatum after either vehicle or cGP treatments. (c), Photograph shows the distribution of capillary (red) and IGF-1 receptor (green) (bar = 100 μm) (d), Photograph shows the morphology of capillary (red) and IGF-1 receptor (green) (bar = 20 μm). (e), The number of capillaries with IGF-1 receptor expression in the hippocampus after either vehicle or cGP treatment. (f), The number of capillaries with IGF-1 receptor expression in the striatum after either vehicle or cGP treatment. (g), The number of capillaries with phosphorylated IGF-1 receptor expression in the hippocampus after either vehicle or cGP treatment. (h), The number of capillaries with phosphorylated IGF-1 receptor expression in the striatum after either vehicle or cGP treatment. Error bars show SEM, #p < 0.05, ##p < 0.01 by two-way ANOVA, indicate the difference between the injured and control hemispheres; *p < 0.05, **p < 0.01 by two-way ANOVA, indicate the difference between the vehicle and cGP treatments.

