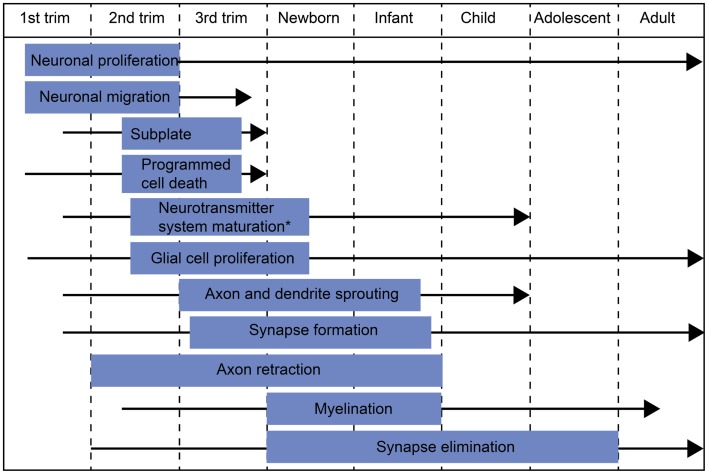
Figure 1.
Schematic diagram of major developmental events during embryonic/fetal life and infancy/early childhood. The blue box indicates the most active period of each developmental process and the black arrow the period when the process continues at a slower pace. *The most active period in neurotransmitter system maturation in general. The exact timescales of maturation for different neurotransmitter systems may differ from the indicated period.

