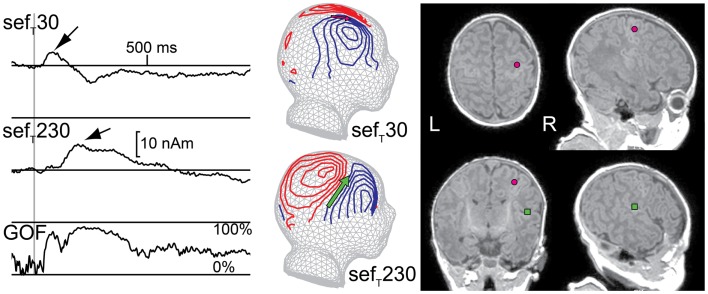
Figure 5.
Responses from primary (SI) and secondary (SII) somatosensory areas in a newborn. Left: multidipole model showing SI and SII source waveforms for the right hemisphere of one newborn. Middle: magnetic field patterns during M60 (SI) and M200 (SII) peaks reflected on a spherical surface and projected onto a schematic newborn head. Right: SI (pink circle) and SII (green square) ECD locations on the newborn’s axial, coronal, and sagittal magnetic resonance images (MRIs). (GOF = goodness of fit)

