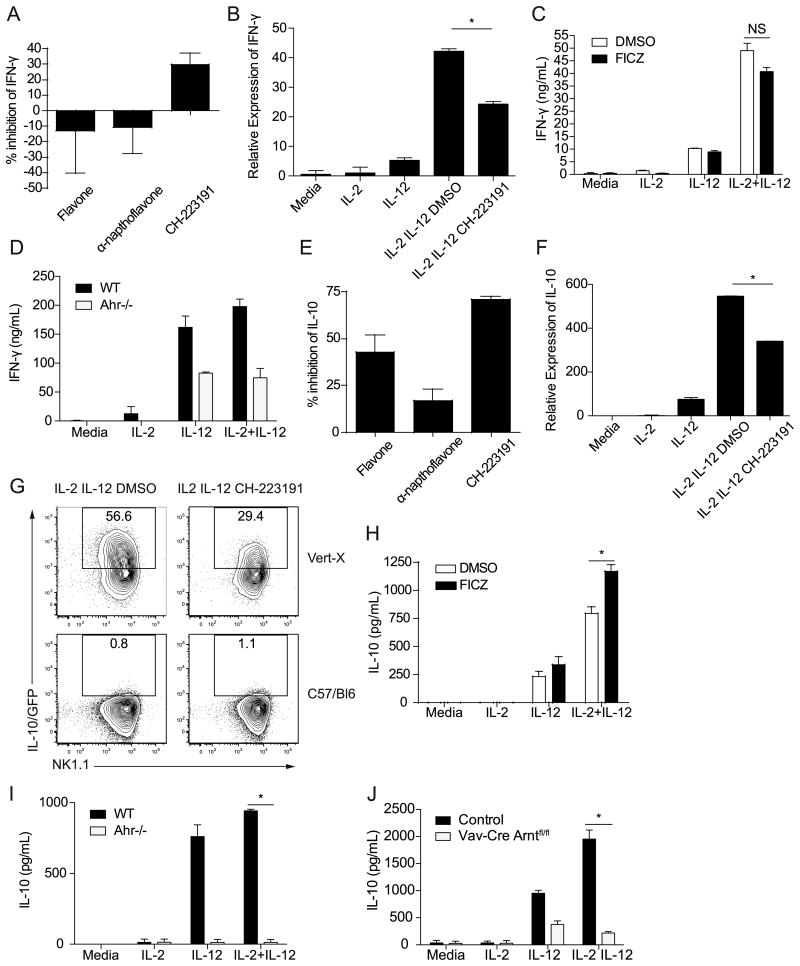
Figure 5. AHR signaling promotes IL-10 production by LAKs.
(A, E) Percent inhibition by AHR inhibitors (flavone, α–napthoflavone and CH-223191) of IFN-γ and IL-10 production by LAKs that were stimulated with IL-2 and IL-12 compared to vehicle control (DMSO) treated cells. The graphs show the average inhibition from 3-9 pooled independent experiments. (B, F) IFN-γ and IL-10 transcript expression by LAKs stimulated for 6 hours or 27 hours respectively. Sample transcript levels were normalized based on HPRT expression, and calibrated to the IL-2 treated sample. Results are representative of three similar experiments, and error bars are based on technical replicates (*p<0.05 based on a Student's t test on technical replicates. Similar results were seen in 3 separate experiments). (C, H) IFN-γ or IL-10 production by LAKs stimulated with IL-2 and IL-12 in the presence or absence of FICZ for 48 hours. Graphs show representative data from one experiment. (*p<0.05 based on a Student's t test with replicates in the representative experiment that is shown. These results were also significant (p<.05) in a paired Student's t test with pooled data from 4 independent experiments.) (D, I) IFN-γ or IL-10 production by LAKs generated from Ahr-/- or wild type mice, 48 hours after stimulation with IL-2 and IL-12. Graphs show representative data from one experiment. (*p<0.005 based on a Student's t test with replicates in the representative experiment that is shown. These results were also significant (p<.05) in a paired Student's t test with pooled data from 3 independent experiments.) (G) IL-10/GFP expression by LAKs generated from Vert-X mice 48 hours post-stimulation. LAKs from C57/Bl6 mice were used as controls to gate for IL-10/GFP+ cells. Representative plots from 3 independent experiments are shown. (J) IL-10 production by LAKs generated from a Vav-Cre Arntfl/fl mouse or control 48 hours post-stimulation. Results from one of two independent experiments are shown. (*p<0.0001 based on a Student's t test with replicates in the representative experiment that is shown.) All error bars represent standard error.

