Figure 1.

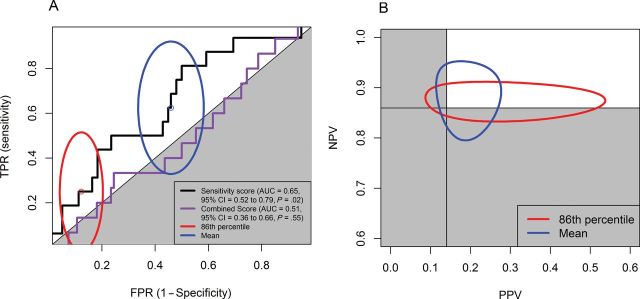
Receiver operating characteristic (ROC) curves of combined score and sensitivity score to predict pathological complete response and 95% confidence intervals of paired (false-positive rate [FPR], true-positive rate [TPR]) and (positive predictive value [PPV], negative predictive value [NPV]) for sensitivity score with two different cutoff points for study GSE16446 (breast cancer). A) Ninety-five percent confidence intervals for (FPR, TPR) sensitivity score. The solid black line and orange line are the ROC curves for sensitivity score and combined score, respectively. B) Ninety-five percent confidence intervals for (PPV, NPV) sensitivity score. Cutoff points were 1) the 86th percentile (1 − the pathological complete response rate of GSE16446 study; red ellipses) and 2) the mean (the standard cutoff point used by the Medical Prognosis Institute; blue ellipses). Gray area indicates the region for the prediction made by chance. AUC = area under the curve; CI = confidence interval.
