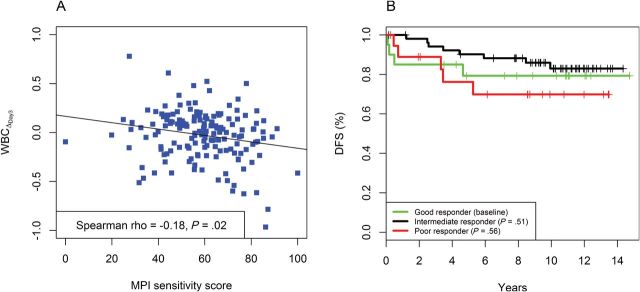
Figure 2.

Association between the Medical Prognostic Institute (MPI) sensitifit score and outcome in study GSE10255 (acute lymphoblastic leukemia). A) Scatter plot of sensitivity score versus change in the levels of circulating leukemia cells at day 3 after the start of treatment ( ) and the fitted line by linear regression. B) Kaplan-Meier plots of disease-free survival (DFS) categorized by MPI sensitivity score. A good responder was a patient with top 25% sensitivity scores (n = 20). An intermediate responder was a atient with middle 50% sensitivity scores (n = 53). A poor responder was a patient with bottom 25% sensitivity scores (n = 19).
