
Figure 5.
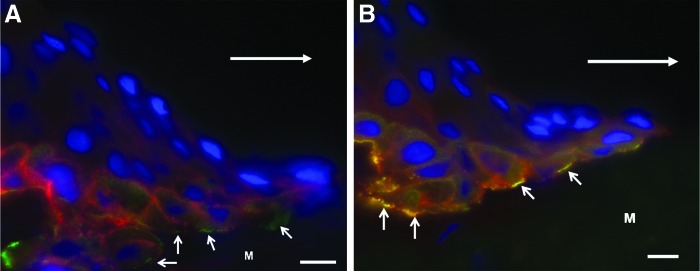
The images show the migrating tongue of keratinocytes in an incisional human wound at 30 h after wounding. The cells were moving toward the right [large arrows in (A) and (B) indicate the direction of movement]. (A) The section was prepared for immunofluorescence using antibodies against α3 integrin (red) and BPAG1e (green). The nuclei are stained with DAPI (blue). α3 integrin (red) is predominantly at sites of cell-to-cell contact with no clear co-distribution with BPAG1e (green) located along the advancing wound margin juxtaposed to the wound matrix (arrows). (B) The section was costained with antibodies against β4 integrin (red) and BPAG1e (green). The nuclei are stained with DAPI (blue). Note that β4 integrin and BPAG1e co-distribute as evidenced by the yellow color along the wound margin (arrows). M, matrix of wound bed. These images were presented in Underwood et al. as Figs. 8C and 5C.104 Scale bar, 10 μm.