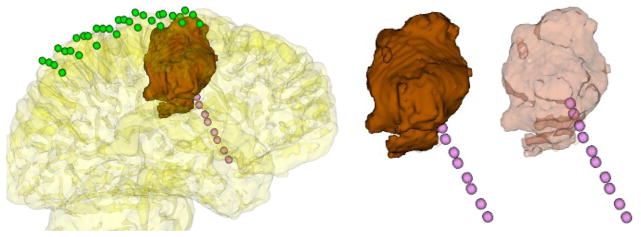
Fig 10.

An 8×4 grid (green) and a 10×1 depth electrode array (pink) are illustrated along with a lesion (brown) extracted and visualized under a partially transparent cortical surface. The extent of the lesion and its position relative to the electrodes can be analyzed more easily on a partially transparent cortical surface (left). In addition, depth electrodes and the extracted lesion (middle) are likewise illustrated on a partially transparent cortical surface (right). In this way, the epilepsy surgery team can identify the electrode positions relative to the lesion. As seen in the figure to the right, the last two depth electrodes on the strip are actually inside the tumor, which is not evident when the lesion is shown opaquely, as in the middle figure.
