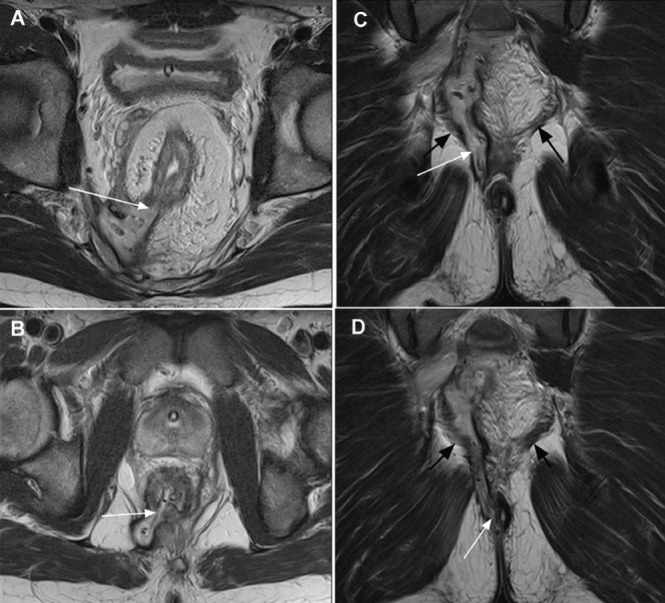
Figure 7).

A Upper axial T2 image shows fistula at 07:00 (arrow). B Lower axial T2 image shows a second fistula also at 07:00 (arrow). C Coronal image demonstrates vertical extent of fistula breaching (white arrow) the left levator ani muscle (black arrows). D Coronal image demonstrates the fistula exit at the anal verge; clinical inspection may have indicated an inter-sphincteric fistula. Magnetic resonance imaging elegantly displayed the full complex fistula anatomy
