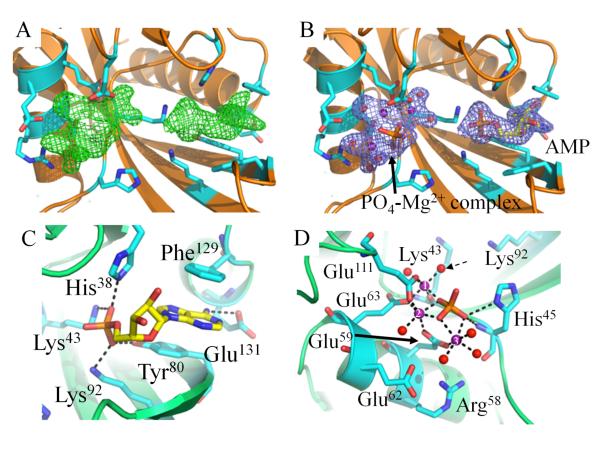
Figure 4. Crystal Structure of CT771 Bound to Hydrolyzed Ap4A Product.
A, Fo-Fc map (green mesh at 3.0 σ contour) of the refined structure in the absence of modeled ligands. Active site side chains within hydrogen bonding distance (2.5 – 3.5 Å) of bound ligands are depicted as cylinders (cyan) in all panels. CT771 backbone is depicted in cartoon ribbon format (orange). B, 2Fo-Fc map (blue mesh at 1.0 σ contour) of the refined structure with one AMP and one PO4-Mg2+ complex modeled per subunit. Color scheme is the same as panel A. C, Active site side chains within hydrogen bonding distance (2.5 – 3.5 Å) of AMP (yellow). CT771 backbone is depicted in cartoon ribbon format (lime). D, Active site side chains within hydrogen bonding (2.5 – 3.5 Å) and metal coordination (1.7 – 2.2 Å) distances of PO4-Mg2+ complex. Magnesium ions and water molecules are represented as spheres and colored purple and red, respectively. Dashed arrow identifies proposed nucleophilic water. Magnesium ions are numbered according to Table S1. The phosphate is colored orange. Color scheme is the same as panel C. Further information on the interaction distances within panels C and D can be found in Table S1.

