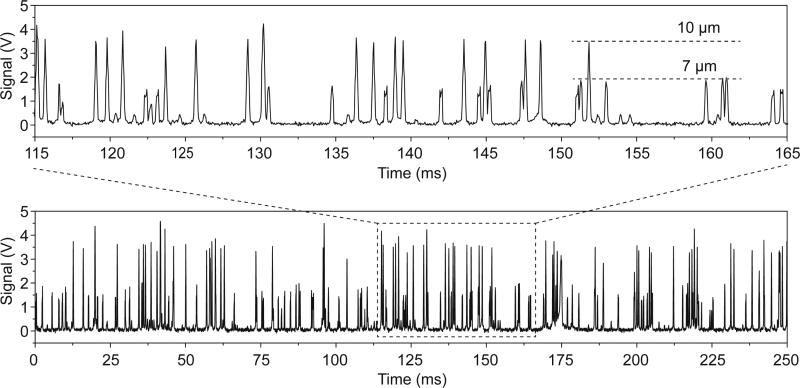
Fig. 4.
A data plot of fluorescent peak signals (bottom plot) showing the simultaneous measurement of two types of microparticles with different diameters (7 and 10 μm). The upper inset is an exploded plot focusing on a time interval of only 50 ms where the signal levels from different diameter particles is clearly visible.

