
Fig. 6.
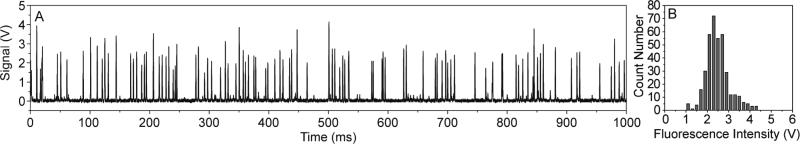
(A) A data plot of fluorescent peak signals showing the measurement of HL-60 cell with the SSAW-based microfluidic cytometer. (B) The distribution of peak intensities recorded over 4 s using SSAW focusing.
Official websites use .gov
A
.gov website belongs to an official
government organization in the United States.
Secure .gov websites use HTTPS
A lock (
) or https:// means you've safely
connected to the .gov website. Share sensitive
information only on official, secure websites.
(A) A data plot of fluorescent peak signals showing the measurement of HL-60 cell with the SSAW-based microfluidic cytometer. (B) The distribution of peak intensities recorded over 4 s using SSAW focusing.