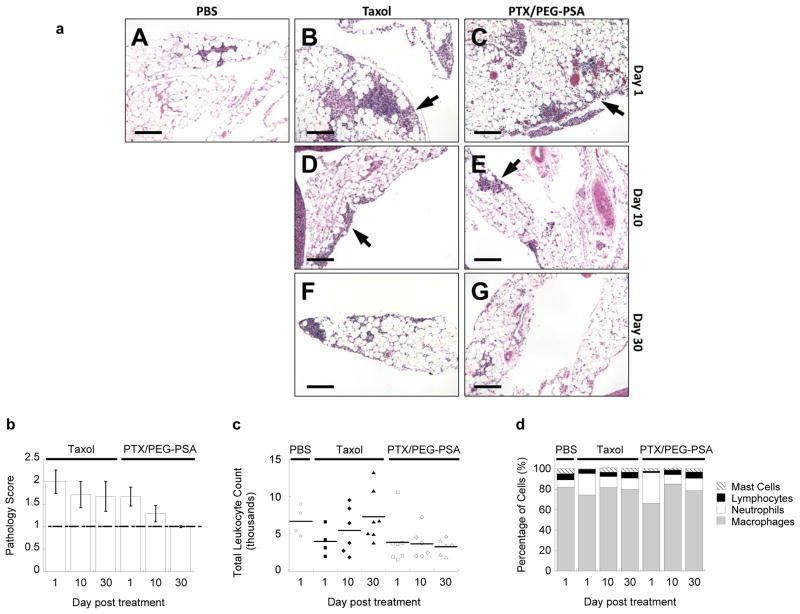
Fig. 3.
Toxicity associated with IP Taxol® and PTX/PEG-PSA particles. (a) Representative histological images of mesenteric inflammatory cells for each treatment and time point. PBS (A), Taxol (B, D, F) and PTX/PEG-PSA (C, E, G) treatment groups are shown at day 1 (A, B, C), day 10 (D, E) and day 30 (F, G) post treatment. Arrows indicate groups of inflammatory cells. Scale bars are 100 μm. (b) Pathology scores of representative hematoxylin and eosin-stained tissue sections of abdominal organs from mice receiving Taxol® or PTX/PEG-PSA particles. Dashed line represents the baseline score of PBS-treated mice. (c) Total leukocyte count from peritoneal lavage samples. No significant differences were noted between groups (p > 0.05). (d) Relative proportion of different leukocytes in the peritoneal lavage samples from mice receiving Taxol® or PTX/PEG-PSA particles. Data represent mean ± S.E.M. (n ≥ 4 per treatment set)

