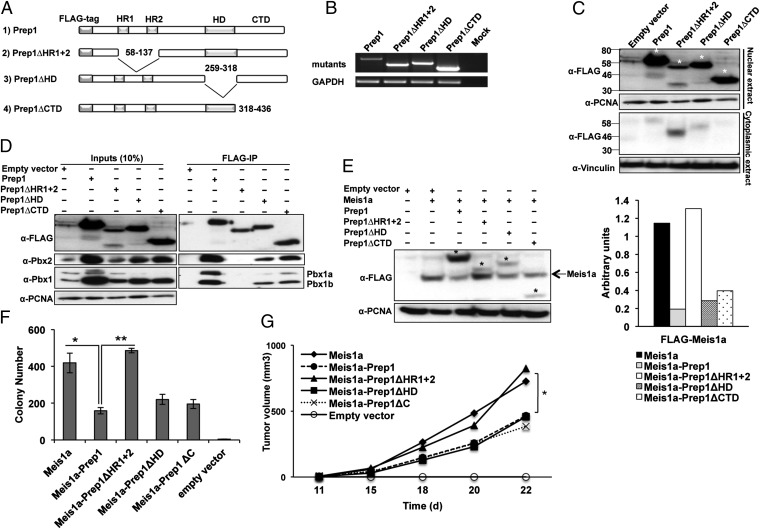
Fig. 3.
Identification of the Prep1 domain involved in inhibiting Meis1a-induced transformation. (A) Schematic representation of WT and mutant Prep1 proteins showing the positions of the Pbx interacting domain (HR1 and HR2), HD, and CTD. Blank spaces represent deletions. (B) RT-PCR analysis of different Prep1 mutants and GAPDH expression in Prep1i/i cells. (C) Intracellular location of the Prep1 mutants. Nuclear and cytoplasmic lysates were analyzed by immunoblotting with anti-FLAG antibody. PCNA and Vinculin were used as loading controls for nuclear and cytoplasmic lysates, respectively. Asterisks show the migration of the bands corresponding to FLAG-Prep1 and the mutants. (D) Pbx1 binding activity of the Prep1 mutants; 300 μg nuclear extracts of the Prep1i/i MEFs infected with FLAG-Prep1, Prep1 deletion mutants, or empty vector were immunoprecipitated using M2 anti-FLAG affinity resins and immunoblotted with the anti-Prep1–, anti-Pbx1–, and anti-Pbx2–specific antibodies. One-tenth of the lysates used for immunoprecipitation was loaded as input. (E) Effect of the Prep1 mutants on the level of Meis1a. Nuclear lysate was analyzed by immunoblotting using anti-FLAG antibody. PCNA was used as loading control. The migration of the FLAG-Meis1a band is shown by an arrow, and that band of FLAG-Prep1 and mutants is shown by asterisks. Bar graph shows the densitometric analysis. Meis1a values are normalized to the levels of PCNA. The data shown derive from a single experiment but are representative of at least three experiments showing the same result. (F) Effect of the Prep1 mutants on the colonogenic activity of Meis1; 1 × 10⁵ Prep1i/i MEFs retrotransduced with Meis1a and Prep1 mutants were subjected to anchorage-independent soft agar growth assay. The number of colonies formed after 2 wk of culturing is shown (*P < 0.01, comparison with Prep1i/i MEFs reexpressing Prep1; **P < 0.0001, comparison with Prep1ΔHR1+2-overexpressing cells). Data represent the mean of three independent wells. Error bars indicate SD. (G) Effect of the Prep1 mutants on the tumorigenic activity of Meis1a. Prep1i/i MEFs overexpressing Meis1a-Prep1 or Prep1 mutants were s.c. transplanted into nude mice (1 × 10⁶ cells per animal), and the tumor volume was monitored. Lines represent the average of five animals per group. Differences between Prep1i/i-overexpressing Meis1a and Meis1a plus Prep1, Prep1ΔHD, or Prep1ΔC groups are statistically significant (*P < 0.05).

