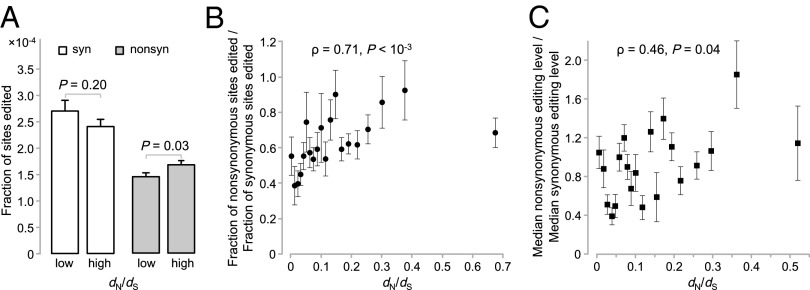
Fig. 3.
Reduced RNA editing in genes with low nonsynonymous to synonymous rate ratios (dN/dS). (A) Fractions of synonymous and nonsynonymous sites edited in the 50% of genes with low dN/dS (median dN/dS = 0.055) and the 50% of genes with high dN/dS (median dN/dS = 0.250). Error bars show one SD. P value is from χ2 test. (B) The fraction of nonsynonymous sites edited relative to the fraction of synonymous sites edited (fn/fs) increases with dN/dS. Each dot represents 5% of all human genes with dN/dS estimates. (C) The median nonsynonymous editing level relative to the median synonymous editing level increases with dN/dS. Each dot represents 5% of all human genes with edited sites and editing level information. In B and C, ρ and P value are from Spearman’s rank correlation based on the binned data. Error bars in B and C show SDs estimated from 1,000 bootstrap samples.

