Fig. 3.
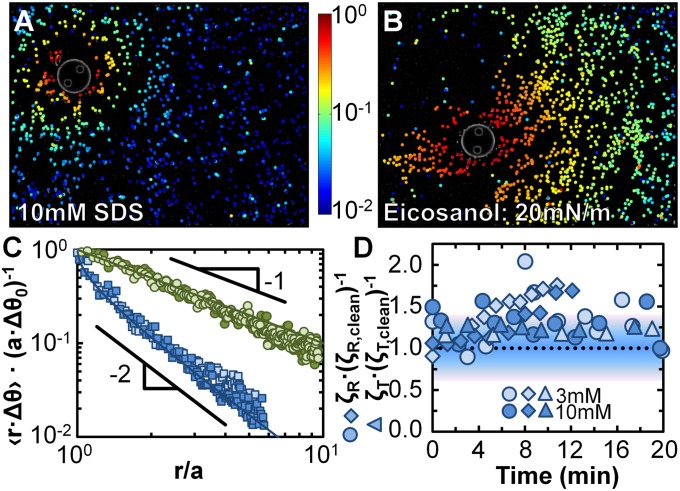
Visualization of surface flow fields during oscillatory rheology experiments. Colormap images show the averaged, normalized azimuthal displacement amplitude r Δθ of interfacial tracer particles, normalized by the displacement amplitude aΔθ0 of the microbutton boundary, as a 50-μm microbutton is driven into gentle rotational oscillations, on (A) a 10-mM SDS solution and (B) an insoluble, viscous eicosanol monolayer (Π ∼ 20 mN/m). (C) On both monolayers, the measured surface velocity matches the microbutton velocity at the boundary. The velocity profiles decay differently for SDS monolayers (for which vθ ∼ r−2, as expected for surface-dominated monolayers) and eicosanol monolayers (for which vθ ∼ r−1, as expected for surface-dominated monolayers). Blue markers represent SDS monolayers (light blue squares: 3-mM SDS, Δθ0 = 0.15 rad; dark blue squares: 10 mM, Δθ0 = 0.15 rad), and green markers eicosanol (light green circles: Π = 20 mN/m, ηS = 4 μN·s/m, Δθ0 = 0.04 rad; dark green circles: Π = 35 mN/m, ηS = 3 μN·s/m, Δθ0 = 0.03 rad). Solid lines represent theoretical predictions (52) for high- and low Bo. Particle adsorption, evident from Movies S1 and S2, increases the effective microbutton radius, more for SDS (∼2–3 particles) than for eicosanol (1 particle). Velocity decay (r−2 vs. r−1) is unaffected by effective radius. (D) Rotational resistance (ζR, diamonds, normalized by ζR,clean) measured during particle-tracking experiments for SDS solutions are O(1), confirming the subphase-dominated response. For comparison, normalized rotational and translational resistance (ζR, circles and ζT, triangles) measured simultaneously with 10-μm microbuttons for 3- and 10-mM SDS solutions, are also all subphase-dominated. The shaded background reflects an ∼40% uncertainty in the magnetic force, and thus the measured ζ.

