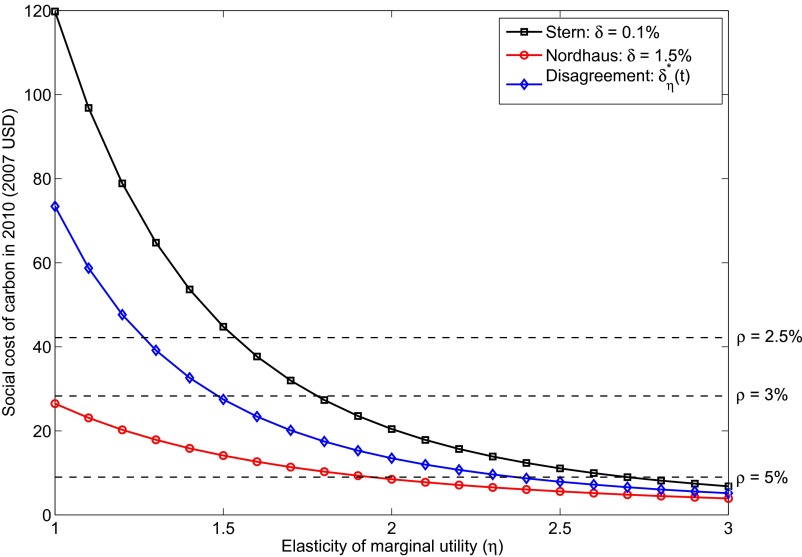
Fig. 1.
The SCC as a function of η for two constant utility discount rates [Stern (black),  ; Nordhaus (red),
  ] and for the efficient discount rate under disagreement (blue) given by
  in Eq. 6. The values of the SCC under the three constant consumption discount rate scenarios used by the IWG are indicated by the dashed lines.

