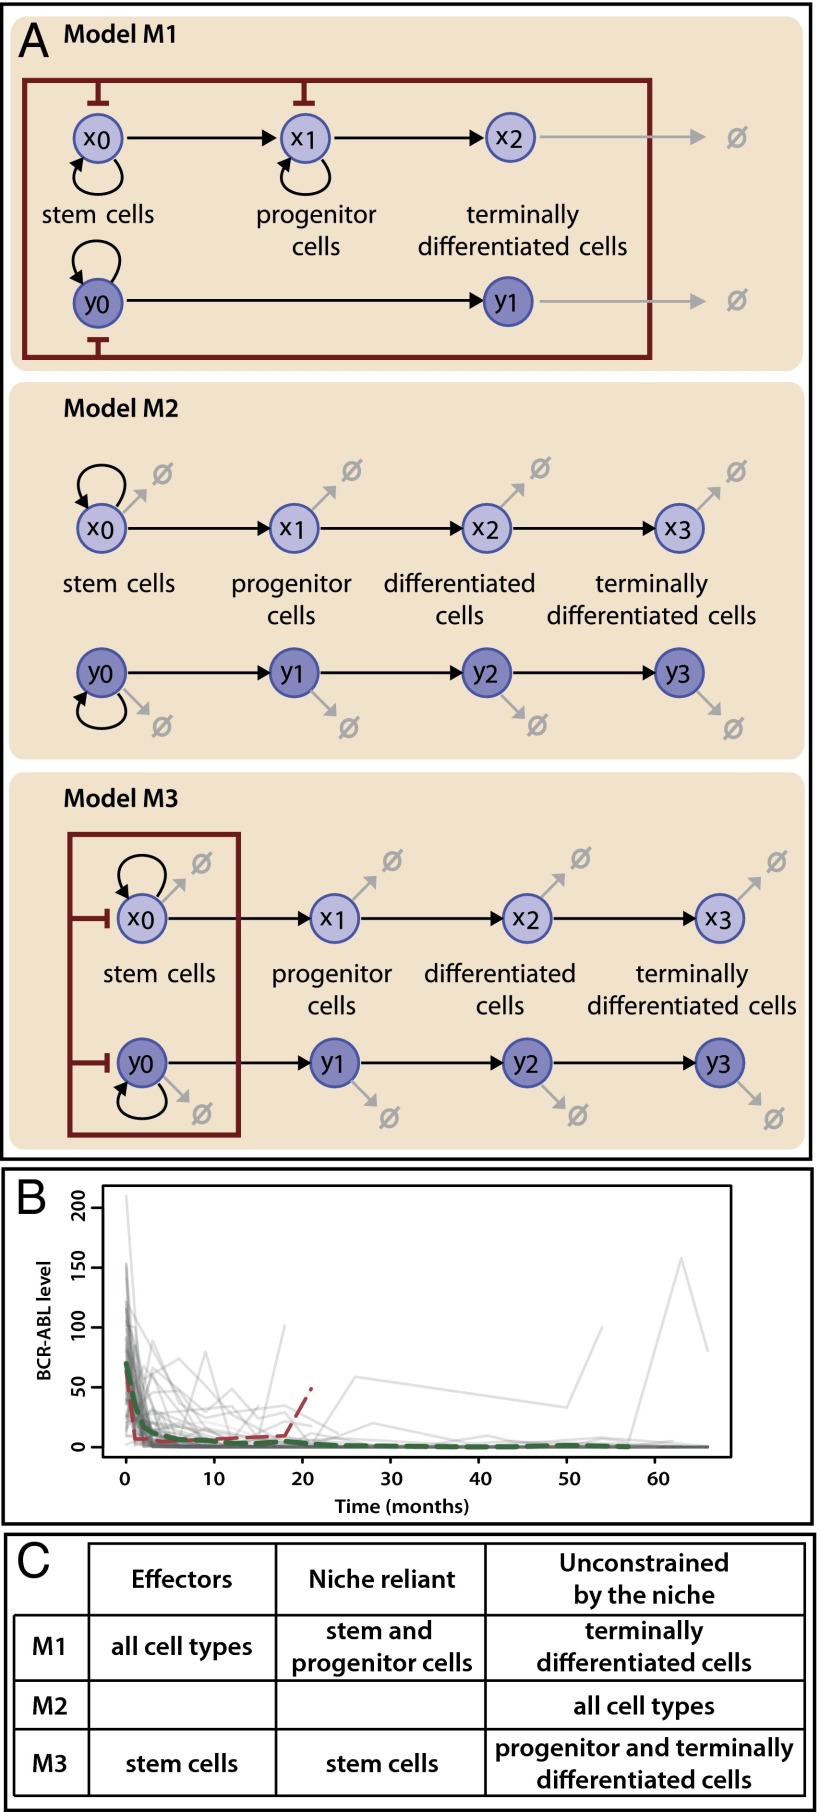
Fig. 1.
Mechanistic models for hematopoiesis in CML and experimental measurements of leukemia progression in patients. (A) Graphical description of models M1, M2, and M3. The hematopoietic niche is represented by a red rectangle: every species inside the rectangle influences the niche, whereas only species marked by red inhibitory arrows are affected by it. Cell death is illustrated by light gray arrows. (B) The change in the BCR-ABL level over time (in months) is represented by gray lines for each of the 69 patients under CML treatment. The average change over all patients is illustrated by a dashed green line; the change in the BCR-ABL level for a patient who exhibits disease relapse is illustrated by a dashed red line. Our model comparison analysis is based on these two trajectories. (C) Description of how niche competition is treated by each model. Each species can impact the niche (effector), be affected by the niche (niche reliant), and/or be fully unconstrained by the niche.

