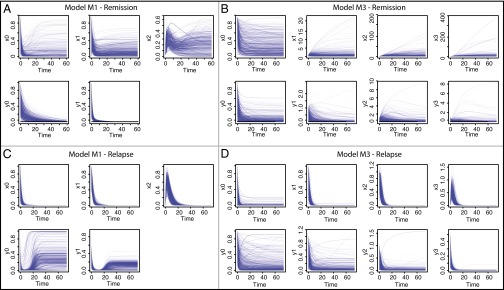
Fig. 3.

The predicted change over time of each species for a timespan of 6 y (the total period of the trial), for (A and C) model M1 and (B and D) model M3 and (A and B) remission and (C and D) relapse. For each model and each outcome, 1,000 parameter sets were sampled from the posterior distribution and each line corresponds to the simulated trajectory for one of these parameter sets.
