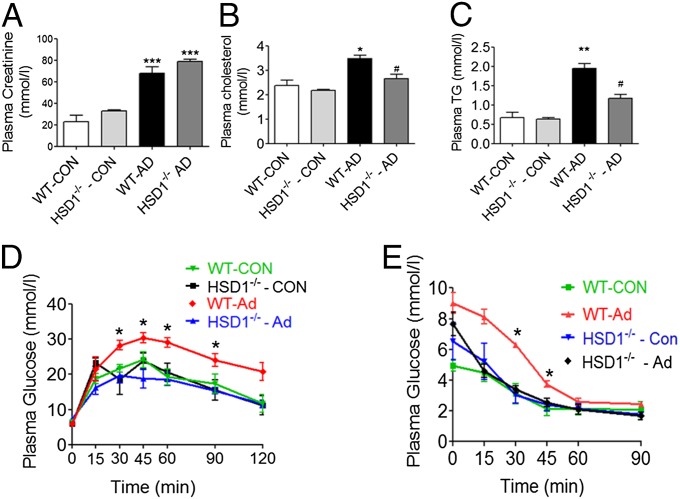
Fig. 8.
11βHSD1−/− mice have improved insulin sensitivity and glucose tolerance and a favorable lipid profile despite uremia. Experimental uremia was induced in mice by administration of 0.25% Ad (n = 8 per group). (A) Plasma creatinine, (B) total plasma cholesterol, (C) plasma triglycerides, (D) plasma glucose response to 2 g per kg dextrose injected i.p. (GTT), and (E) plasma glucose response to i.p. PTT. Data are expressed as mean ± SEM. Statistically significant differences between sham and Adenine diets are indicated by *P < 0.05, **P < 0.01, and ***P < 0.001. Statistically significant differences effects of HSD1−/− are indicated by #P < 0.05.

