
Fig. 6.
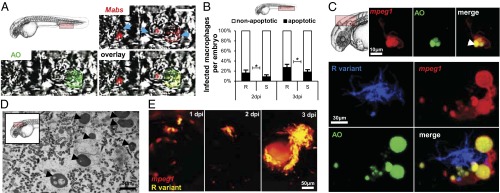
Apoptosis of infected macrophages releases bacteria. (A and B) AO (green) staining of apoptosis cells in living (A and C) or fixed (B) infected embryos. (A) Representative single confocal planes fluorescence and DIC overlay of three individual macrophages (blue arrows) infected with tdTomato M. abscessus (red). (Inset) AO labeling (green) shows the presence of one M. abscessus-infected apoptotic cell in the vasculature of a 3-dpi embryo. (Scale bar, 10 μm.) (B) Proportion of apoptotic infected macrophages compared with the number of nonapoptotic infected macrophages at the infection site at 2 and 3 dpi [∼300 cfu of the M. abscessus R or S variant injected in tg(mpeg1:mCherry) embryos as counted in the region displayed in the Inset]. Results are expressed as the averages of three independent experiments; error bars represent the SD. Significance was assessed by one-way ANOVA. (C) (Upper) Maximum intensity projection of confocal images with a representative apoptotic noninfected macrophage with apoptotic bodies (arrowhead). (Lower) tg(mpeg1:mCherry) embryos infected with R variant M. abscessus (tdTomato). Maximum intensity projection of confocal images show a serpentine cord (blue) surrounded by several macrophages (red) with apoptotic bodies (green) at 3 dpi. (D) Representative electron micrograph shows extracellular bacteria surrounded by cellular debris and typical apoptotic nuclei (arrowheads) at 7 dpi. (E) Spatiotemporal visualization of cord formation emerging from a macrophage infected with the R variant expressing mCherry in tg(mpeg1:mCherry) embryos.