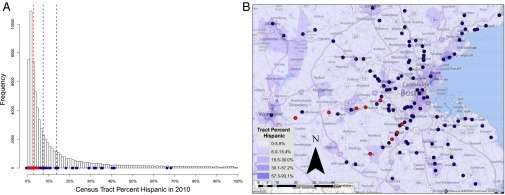
Fig. 1.

Distribution of Hispanic persons (of any race) by Census Tract in the United States and in the experiment location in 2010. (A) Frequency of Census Tracts by percent Hispanic in the United States. Purple dots are percent Hispanic in Census Tracts containing an MBTA station and red triangles are the stations used in the experiment. Dotted vertical lines indicate the means in the United States (black), all tracts containing MBTA stations (purple), and in stations used in the experiments (red). (B) Hispanic persons (of any race) by Census Tract and MBTA stations used in experiment area. Purple dots are MBTA stations and red dots are the stations used in the experiment.
