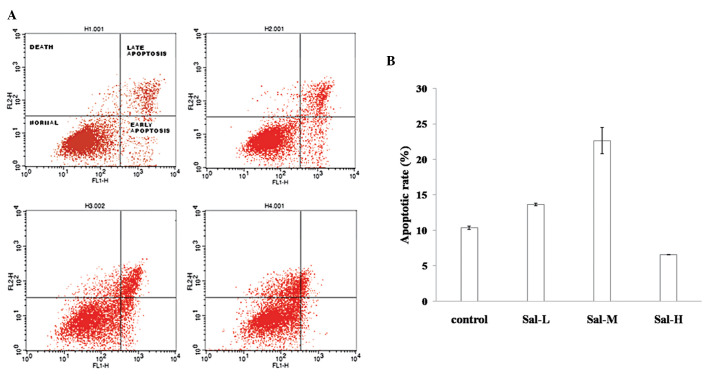
Figure 2.
A549 apoptotic rate to total cells under salvianolic acid A (Sal A) treatment is shown. A549 cells were collected at 24 h after Sal A treatment at concentrations of 10, 20 and 30 μg/ml, respectively. (A) Flow cytometry analysis was used to examine the apoptotic ratio of A549. (B) Results of three experiments were analyzed using the Student’s t-test (P<0.01). Sal-L, Sal-M and Sal H are the concentrations of 10, 20 and 30 μg/ml, repectively.

