Figure 3.
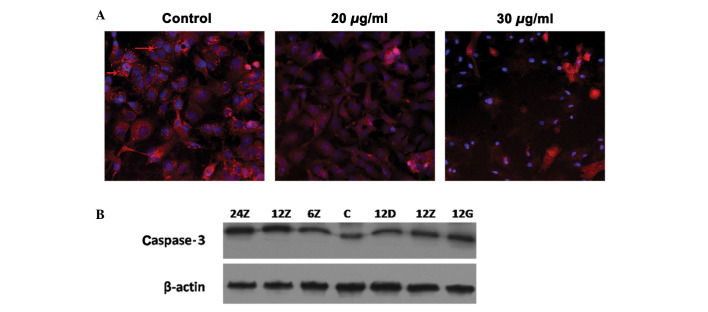
Permeability of mitochondrial membrane regulated in response to salvianolic acid A (Sal A) treatment. A549 was treated with Sal A at 20 and 30 μg/ml. At 24-h treatment, cells were stained with MitoTracker® staining, as the control: the cell membrane exhibited bright red color (red arrow), at 20 μg/ml, the bright red color was weak and at 30 μg/ml, it almost disappeared. (A) Cells became more condensed. (B) Proteins of A549 treated with the same condition as in Fig. 2. Western blot analysis was used to detect the cleaved caspase-3 protein level. The concentrations 24, 12 and 6Z indicate medium dose (20 μg/ml) at 24, 12 and 6 h, respectively. C, Control; 12D, 12Z and 12G are representative of low (10 μg/ml), medium (20 μg/ml) and high concentrations (30 μg/ml), respectively.

