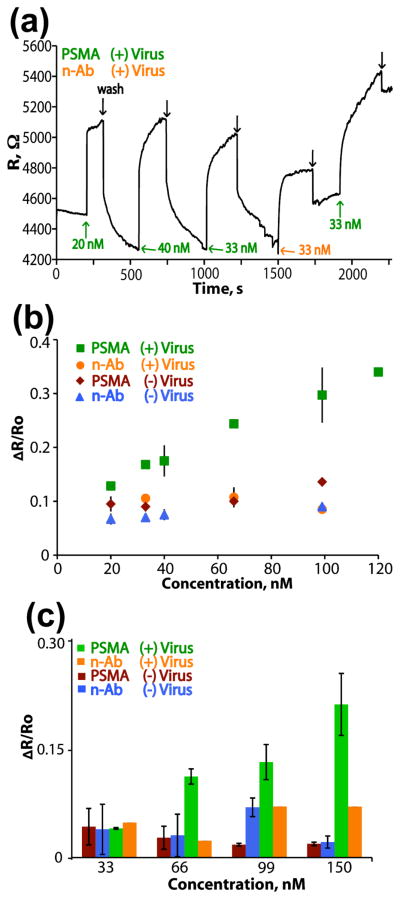
Figure 4.
Real-time biosensing with PSMA-binding PEDOT nanowires. (a) A real-time trace of biosensing data, with the indicated injections of negative antibody (n-Ab), PSMA, or washes with PBF buffer (black arrows). (b) A compilation of all real-time biosensing data, depicted as a calibration curve with error bars indicating standard deviation (n=3). The change in resistance upon injection is plotted versus analyte concentration. (c) A plot demonstrating the change in resistance upon injection of analytes in a solution of synthetic urine (errors bars indicate standard deviation with n=3).

