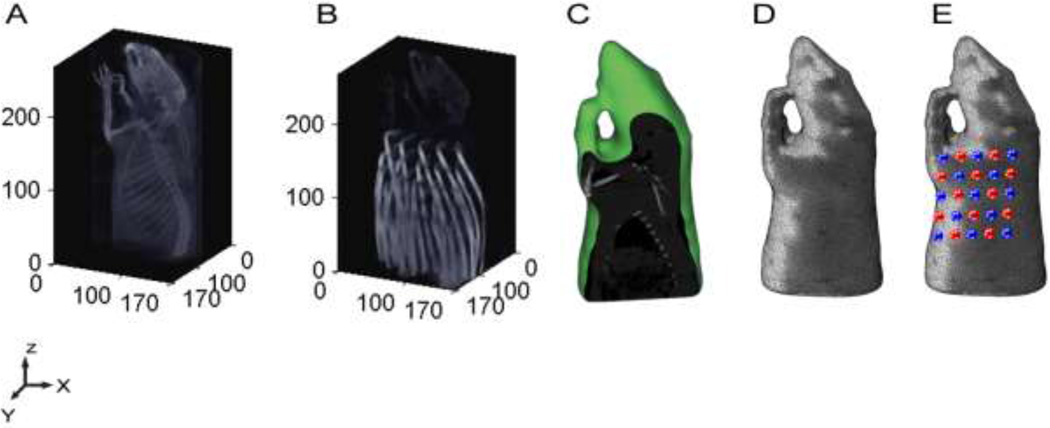
Figure 1.
Fluorescence DOT Image Reconstruction. (A) An X-ray CT is used to capture the three dimension structure of the anatomy of a rat. (B) X-ray CT image with the fiber array of DOT used to obtain optode positions. (C) Sagittal section of the anatomical X-ray CT image after segmentation into bone and soft-tissue region using Mimics™. (D) 3D finite element model (FEM) of small animal half-body mesh generated from CT within Mimics™ to be used for forward modeling of light propagation.(E) Small animal mesh after projection of the optodes (source (red) and detector (blue)). Sensitivity matrix is then generated using with the mesh and the measurement parameters as the main inputs for the FEM modeling of light in tissue using NIRFAST (Dartmouth).

