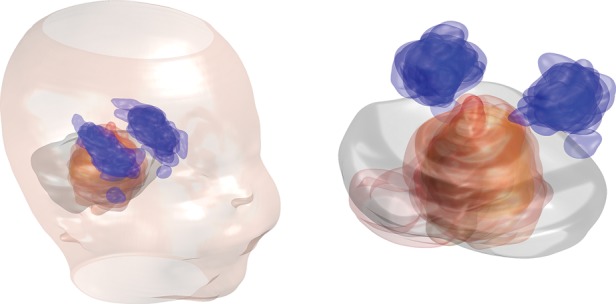
Fig. 4.

The spatial distribution of delineated primary tumor beds in relation to the hippocampi for the patients in our cohort. The tumor beds are shown in red and the hippocampi in blue with the semitransparent structures for all patients overlaid on each other. The locations of these structures are overlaid on a single PF contour representative of most PF volumes in our patient group. For graphical clarity, the tumor beds for 2 patients with very irregular size and outlying position of their operation cavities were excluded from this illustration (these were, however, included in all quantitative analyses).
