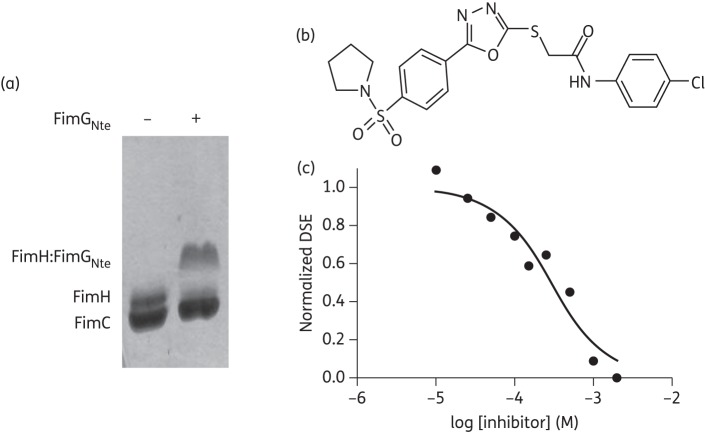
Figure 2.
Inhibition of in vitro DSE. (a) SDS–PAGE showing FimC:FimH DSE with FimGNte after a 12 h incubation. FimH:FimGNte forms an SDS-stable complex that shows a mobility shift compared with FimH. (b) Structure of AL1. (c) Concentration–response curve for in vitro FimC:FimH–FimGNte DSE in the presence of AL1 (0.001–2 mM). DSE progression as a function of AL1 concentration, presented as adjusted volume of pixels of the DSE product (FimH:FimGNte) over the adjusted volume of pixels of the total protein (FimC + FimH + FimH:FimGNte) and normalized over non-treated DSE.

