
Figure 3.
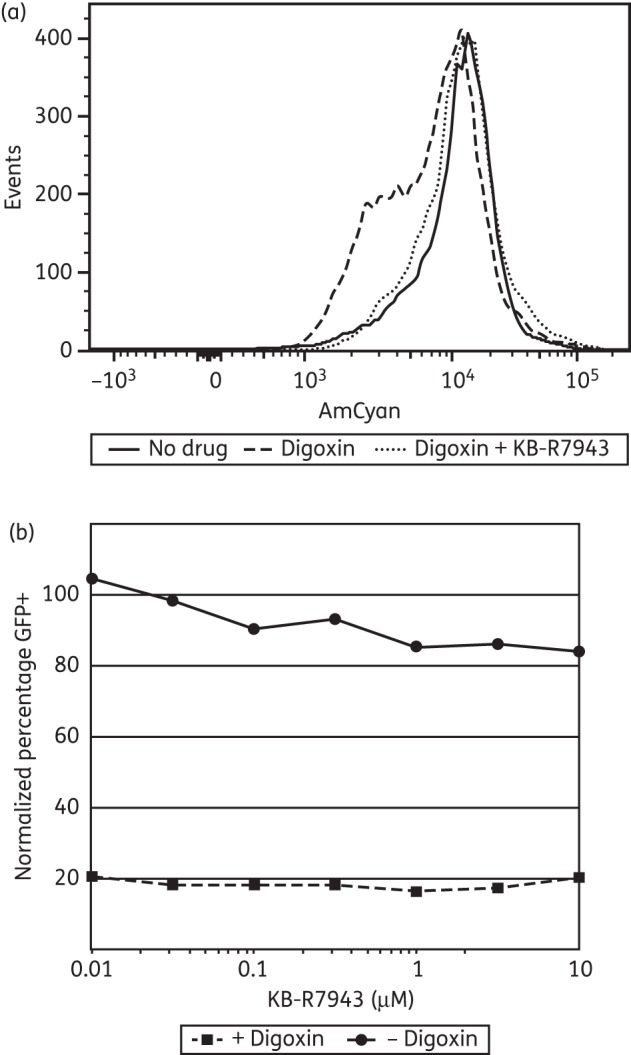
Digoxin inhibition of HIV-1 is independent of digoxin-induced increases in intracellular Ca2+. (a) Flow cytometric analysis of 293T cells treated with DMSO alone, digoxin (1 μM) or digoxin (1 μM) plus KB-R7943 (10 μM) for 18 h and then incubated with Fura Red AM dye (10 μM) for 30 min. Reduced AmCyan fluorescence indicates increased intracellular Ca2+. (b) Flow cytometric analysis of GFP expression in 293T cells transiently transfected with pNL4-3ΔEnvGFP and pX4 and then treated with the indicated concentrations of KB-R7943 alone or in combination with digoxin (1 μM) for 18 h. The percentage of cells expressing GFP is normalized to GFP expression in transfected DMSO-only control 293T cells.