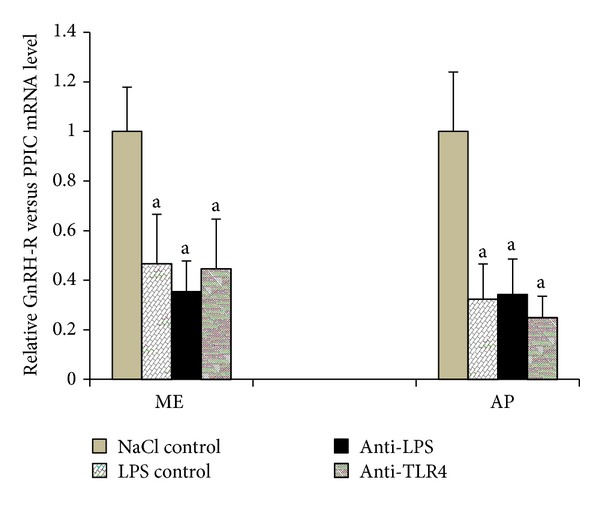
Figure 5.

The effect of central injection of LPS antibody and blockade of TLR4 on the relative GnRH-R mRNA level in the ME and the AP during LPS-induced inflammation. Each point represents mean ± SEM; “a” indicate values that differ significantly according to the Mann-Whitney U test from “NaCl control” (P < 0.01).
