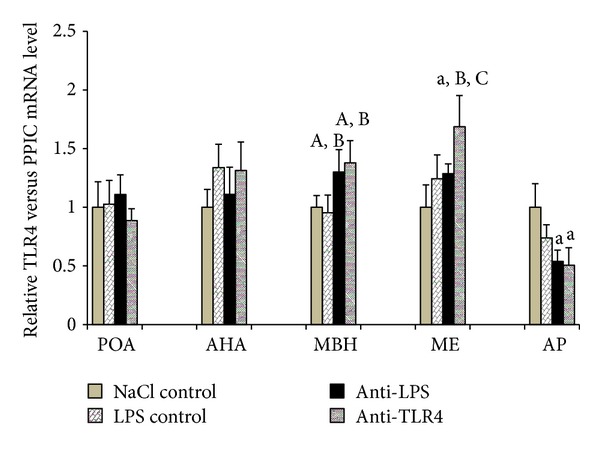
Figure 6.

The effect of central injection of LPS antibody and blockade of TLR4 on the relative TLR4 mRNA level in the hypothalamic structures (POA, AHA, MBH, and ME) and in the AP during LPS-induced inflammation. Each point represents mean ± SEM. Letters indicate values that differ significantly according to the Mann-Whitney U test from “NaCl control” (a P < 0.01; A P < 0.05); “LPS control” (B P < 0.05); “anti-LPS” (C P < 0.05), respectively.
